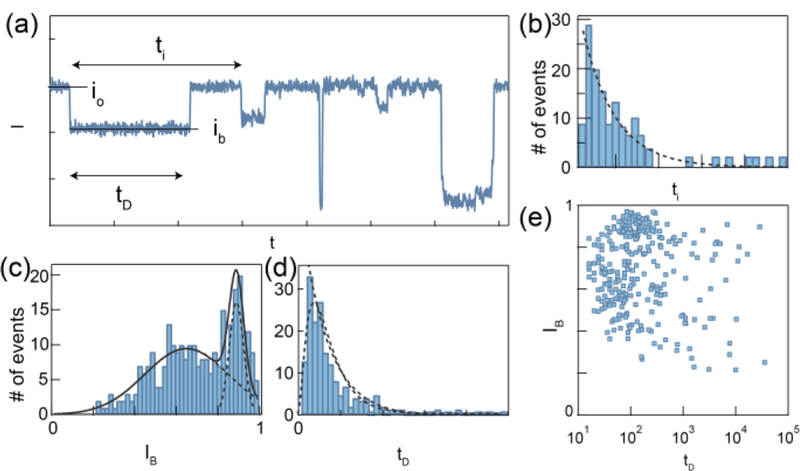
Figure 4.

Basic nanopore signal processing. Example translocations of a model protein. (a) Representative current trace (I) as a function of time (t). Each drop in current is defined as a nanopore event. (b) The time between the start of each event is defined as the inter-event interval (ti), which is fitted by an exponential decay function. (c) The event dwell time (tD) histogram is fitted by either drift-diffusion model or exponential decay function. (d) The ratio between event amplitude (ib) and open pore current (io) is fitted by multimodal distribution. (e) The scatter plot of IB vs tD is used to perform single-molecule protein classification.
