
Figure 8.
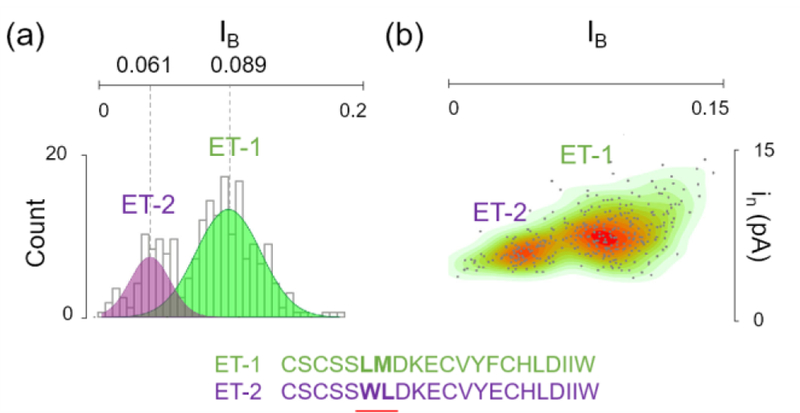
Distinguishing endothelin 1 (ET-1) from endothelin 2 (ET-2) using a FraC nanopore. (a) The translocation data of ET-2 and ET-2 revealed distinguishable fractional blockade current (IB) at 0.089 for ET-1 and 0.061 for ET-2. (b) By adding ET-1 and ET-2 consecutively to the same pore, two distinct populations were observed by plotting the event amplitude standard deviation (in) over the corresponding IB. (c) ET-1 and ET-2 are two nearly isomeric polypeptides differing from each other by 1 amino acid out of 21 as well as the position of a leucine residue (leucine 6 in ET-1 and leucine 7 in ET-2). Adapted with permission from G. Huang, K. Willems, M. Soskine, C. Wloka, and G. Maglia, Nat. Commun., 2017, 8, 935, under Creative Commons Attribution 4.0 International license, Nature Publishing.