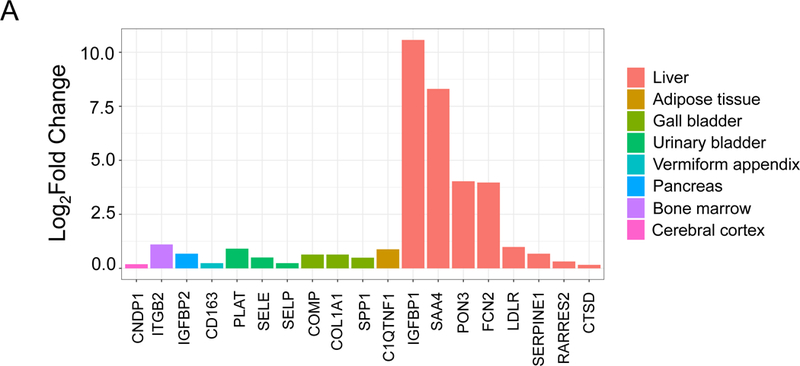
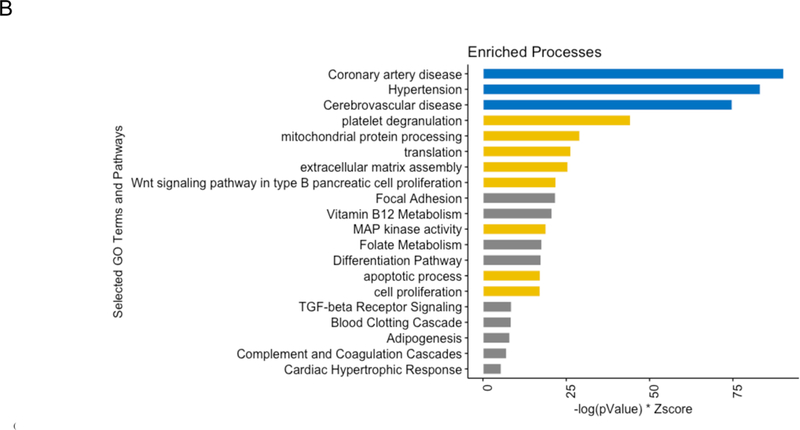
Figure 2.


Functional analysis of 19 proteins differentially expressed in plasma after bariatric surgery. (A) Gene expression in tissue of 19 proteins dysregulated between Visit 1 versus both post-operative time points. The height of each bar represents the fold change between the tissue that has the highest expression of the gene coding the respective protein and the tissue that has the next highest expression of the gene. (B) Bar graph of significantly enriched processes. The results of an enrichment analysis performed on the set 26 proteins expanded from 19 proteins with differences in terms of pre- versus post-bariatric surgery are shown here, ranked by a score of -log(pValue) * Zscore. Three different sources of biological process terms were included: Jensen Disease Ontology (blue), Gene Ontology (gold), and WikiPathways (gray).
