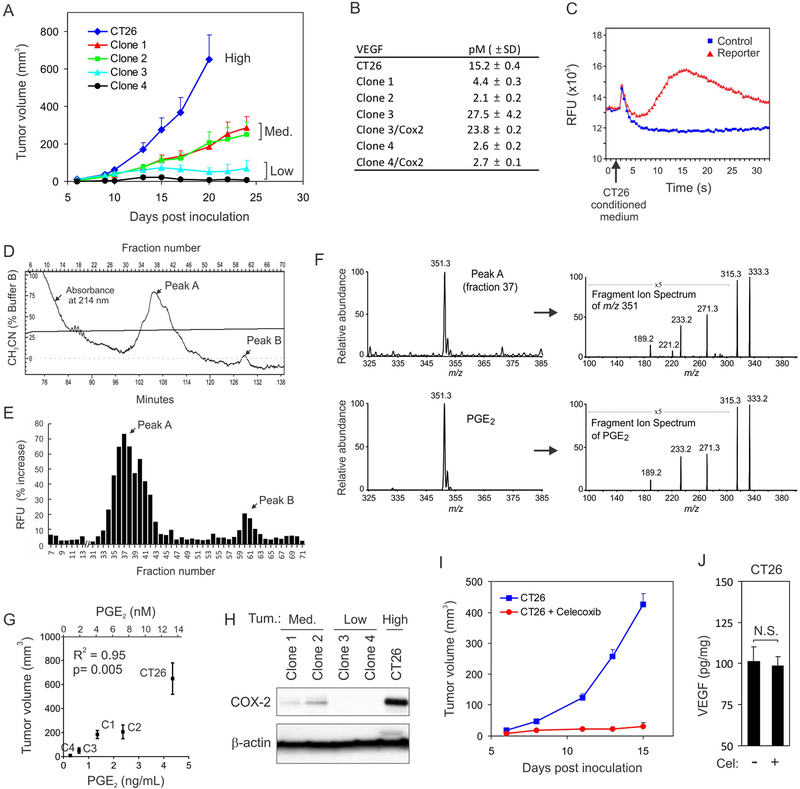
Figure 1. PGE2 is a major tumor-promoting factor produced by CT26 cells.
(A) Subcutaneous tumor growth rates for the CT26 parent cell line and its clonally derived sublines were categorized as high (CT26), medium (Med.; Clone 1, Clone 2) or low (Clone 3, Clone 4).
(B) VEGF concentrations in the conditioned media of CT26-derived cell lines as measured by ELISA.
(c) Conditioned medium from CT26 cells induced a robust calcium flux in reporter cells. The flux could be rapidly measured in a 96-well format using a calcium-sensitive dye. This assay was used to guide biochemical fractionation.
(D) Two separate molecular entities (Peaks A and B) were visualized at 214 nm in the final HPLC column.
(E) The fractions corresponding to Peak A and Peak B in (D) stimulated the highest activity in the calcium mobilization assay.
(F) Electrospray ionization mass spectrometry (ESI-MS) of Fraction 37 from Peak A revealed a molecular ion (m/z 351) and corresponding fragment ion spectrum (top panel) that was identical to pure PGE2 (bottom panel).
(G) Correlation between PGE2 concentration and tumor volume of CT26-derived cell lines 20 days after inoculation.
(H) COX-2 protein in the CT26-derived cell lines as measured by Western blotting.
(I) CT26 tumor growth with or without celecoxib treatment. P < 0.0001.
(J) The amount of VEGF in CT26 tumors with or without celecoxib. N.S.: nonsignificant.
Data in A, I, and J are presented as mean ± SEM.

