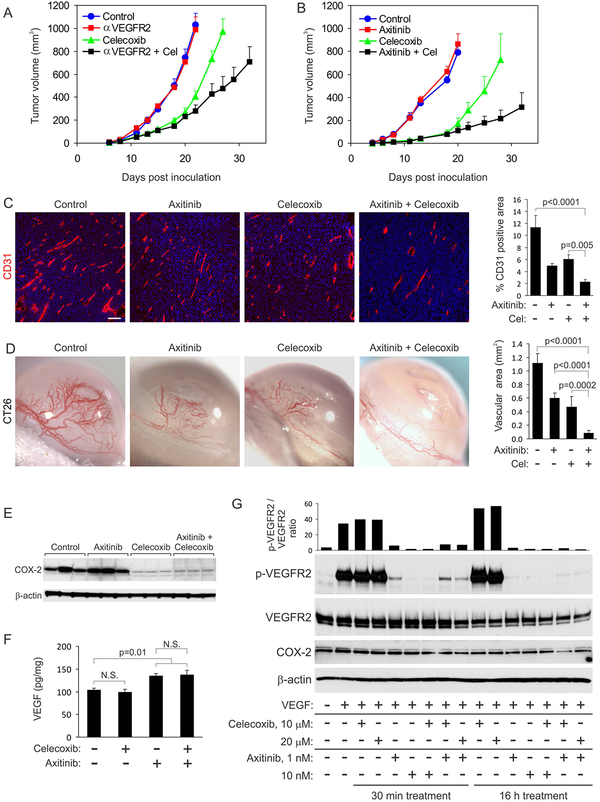
Figure 4. Celecoxib and axitinib modulate independent downstream signaling pathways.
(A) CT26 tumor growth rates in response to celecoxib (Cel) and DC101 (αVEGFR2). Celecoxib therapy was initiated one day after tumor cell inoculation, and DC101 therapy was initiated when tumors reached a size of ~50 mm3.(B) CT26 tumor growth rates in response to celecoxib (Cel) and axitinib. Treatments were initiated as outlined in (A).
(C) Immunofluorescence staining for CD31 (red) was used to assess blood vessel densities in CT26 tumors after treatment with axitinib and celecoxib. Bar: 100 μm. Right panel: quantification of CD31 vessel staining.
(D) The corneal assay was used to measure the effect of systemic axitinib and celecoxib treatment on angiogenesis induced by CT26 tumor spheroids. Right panel: quantification of the corneal angiogenesis.
(E) Western blotting was used to evaluate COX-2 expression in CT26 tumors in vivo in response to axitinib and/or celecoxib (n=3 tumors per group). β-actin was used as a loading control.
(E) An ELISA was used to measure the amount of VEGF in CT26 tumors after treatment with celecoxib and axitinib.
(F) Western blotting was used to assess the impact of celecoxib and axitinib treatment on VEGFR2 phosphorylation and COX-2 expression in HMECs. The top bar graph displays the ratio of phosphorylated VEGFR2 to total VEGFR2.
Data are presented as mean ± SEM.

