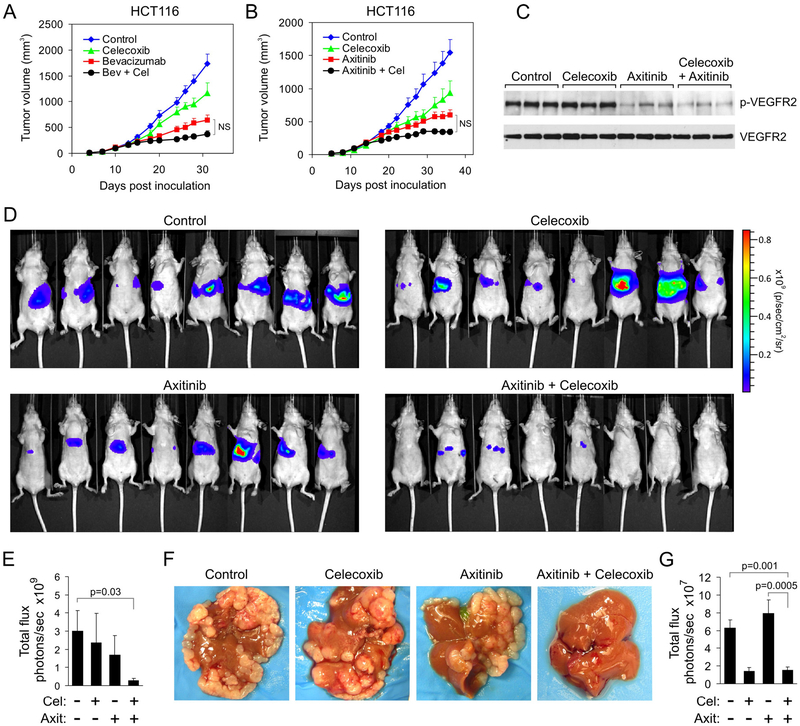
Figure 5. Dual COX-2/VEGF pathway blockade suppresses colon cancer liver metastasis.
(A) HCT116 tumor growth rates in response to bevacizumab (Bev) and celecoxib (Cel). All treatments were initiated when tumors reached a size of ~100 mm3. N.S: Nonsignificant. P values for the other comparisons are provided in table S1.
(B) HCT116 tumor growth rates in response to axitinib and celecoxib (Cel). All treatments were initiated when tumors reached a size of ~100 mm3. N.S: Non-significant. P values for the other comparisons are provided in table S1.
(C) VEGFR2 immunoprecipitation followed by western blotting was used to assess the amount of phosphorylated VEGFR2 (p-VEGFR2) in tumors in vivo after treatment with celecoxib or axitinib.
(D) Bioluminescent imaging of tumor burden 14 days after intrasplenic injection of HCT116-luc cells, applying a maximum luminescence threshold of 1×10¹⁰.
(E) Quantification of tumor burden shown in (D). Celecoxib (Cel); Axitinib (Axit).
(F) Physical appearance of HCT116 tumor burden in the liver.
(G) Whole body bioluminescent quantification 14 days after intrasplenic injection of CT26-luc cells. The whole body data are comparable to bioluminescent quantification of ex vivo livers (see fig. S12C). Cel: Celecoxib; Axit: Axitinib.
Data are presented as mean ± SEM.

