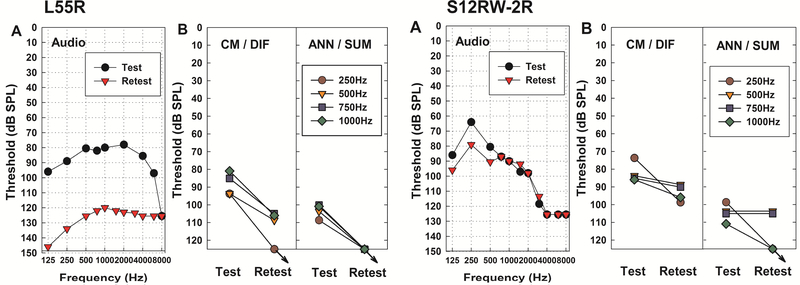
Figure 10.
Correlations between CM/DIF and ANN/SUM thresholds and audiometric thresholds across tested frequencies. Solid lines represent linear regressions for each frequency. The dashed line is a reference line, indicating the 1:1 relationship between audiometric and physiologic thresholds. The dashed line is a reference line indicating equal physiologic and audiometric thresholds.

