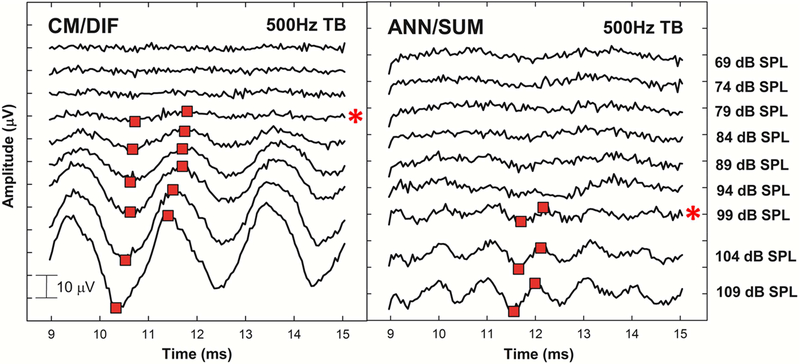
Figure 5.
Amplitude growth functions of CM/DIF and ANN/SUM responses to 500Hz tone bursts from all participants. Solid black lines with filled symbols show the grand mean ± 1 SD. Light grey lines with empty symbols indicate individual subject data. Notice the different scales applied to ordinates of CM/DIF and ANN/SUM responses.

