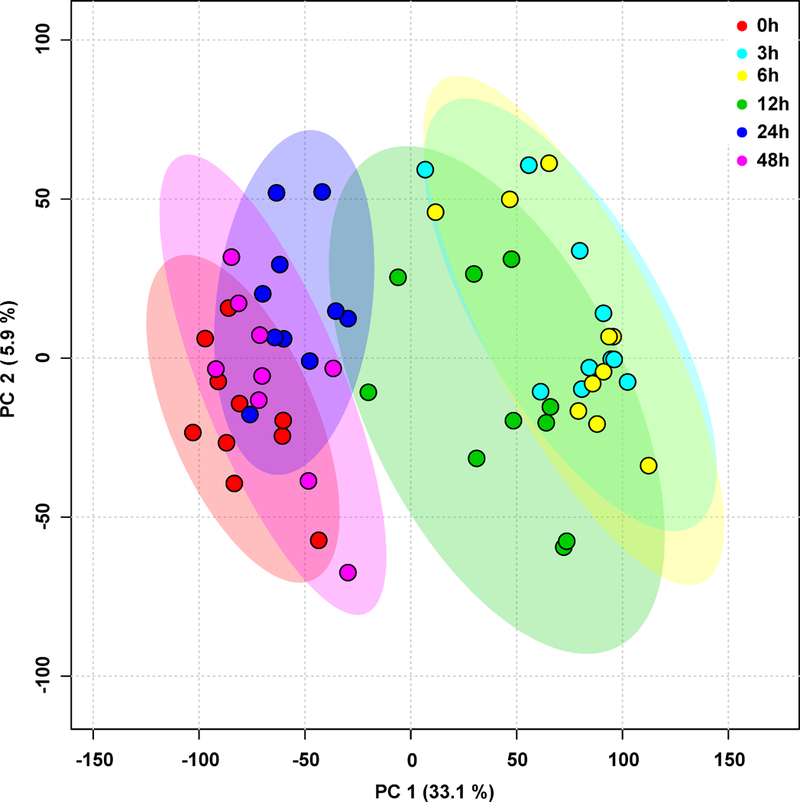
Figure 1. Plasma metabolomic profiles differ over time following broccoli sprout consumption.

Principal components analysis (PCA) was conducted after log transformation on all features detected in plasma of subjects (positive and negative ion modes merged, SFN and SFN isothiocyanates excluded). Each symbol represents a subject at a specific time point. n = 10 for all time points (except 48h, n = 9).
