
Figure 3. Profiles of plasma metabolites following broccoli sprout consumption show significant changes over time.
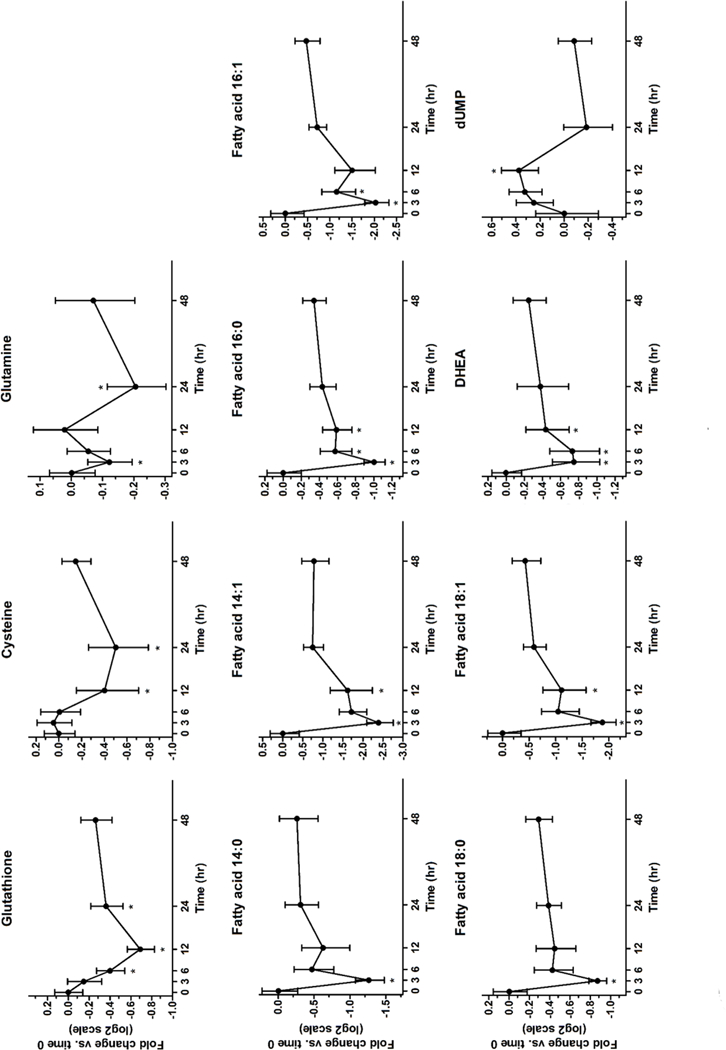
Log2 fold changes are normalized to the group mean value at time 0. Values represent mean fold change ± SEM. n = 10 for all time points (except 48h, n = 9).