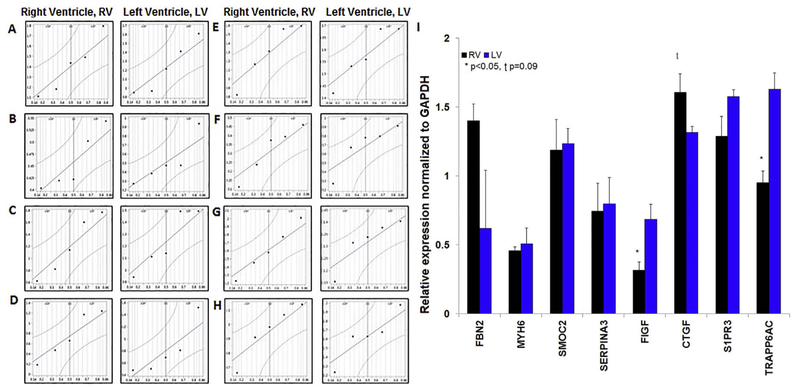
Fig. 3.
Expression of key proteins in non-failing LV and RV tissue.
Quantile plots illustrating distribution of RV and LV non-failing samples (n = 5 each group; logarithmic scale): FBN2 (A), MYH6 (B), SMOC2 (C), Serpina3 (D), FIGF (E), CTGF (F), S1PR3 (G), TRAPP6AC (H). Relative protein expression (normalized to GAPDH) in non-failing RV and LV tissue with significant differences (*) in FIGF, TRAPP6AC, and CTGF (I). Representative (single sample) immunoblots of each protein in RV and LV tissue in Supplementary Fig. 1.

