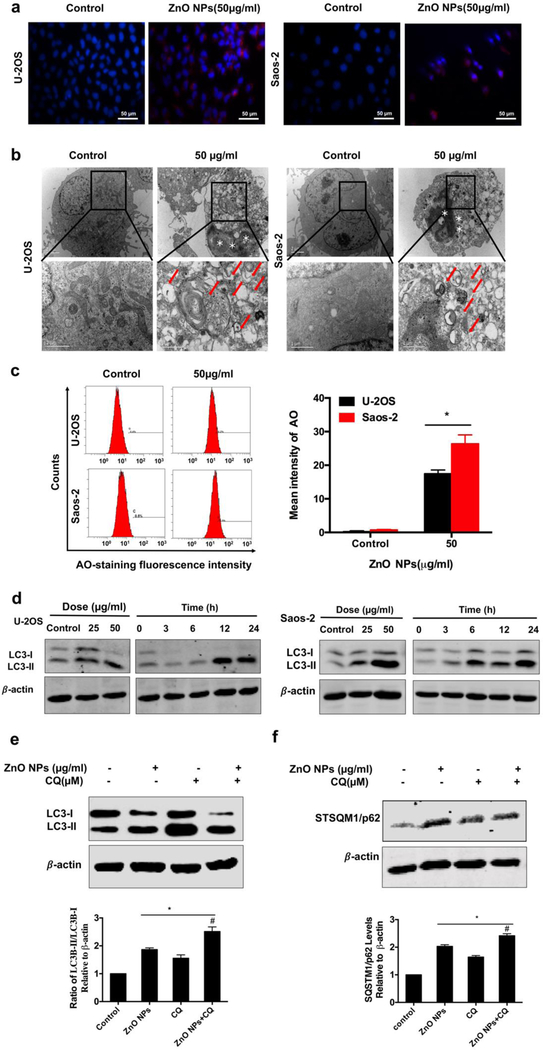
Figure 4.
Autophagy involved in ZnO NPs-induced osteosarcoma cell death with impairment of lysosomal functions. (a) Immunofluorescence staining of the LC3 protein in U-2OS and Saos-2 treated with 50 μg/ml ZnO NPs for 24 h (×400). (b) TEM images showing the formation of autophagosomes and ultrastructural change of nucleus. Red arrows indicated autophagosomes containing intact and degraded cellular debris. Asterisks indicated nuclear condensation or fragmentation. (c) Flow cytometry of the cells after they were treated with or without ZnO NPs for 24 h and stained with AO. (d) Western blotting analysis of LC3 levels after the cells were treated with various concentrations of ZnO NPs for 24 h or incubated with ZnO NPs (50 μg/ml) for different times. (e, f) Western blotting analysis of LC3 (e) and p62 (f) levels in U-2OS cells after they were incubated with or without ZnO NPs (50 μg/ml) for 24 h after 2 h pre-treatment with CQ (10 μM). LC3 and p62 levels were detected by western blotting and quantified by densitometric analysis relative to β-actin. Statistically significant differences were evaluated using the paired Dunnett`s t-test or one-way ANOVA. Results were expressed as the mean ± S.D. from three independent experiments. *P<0.05 versus control, #P<0.05 versus ZnO NPs treatment.

