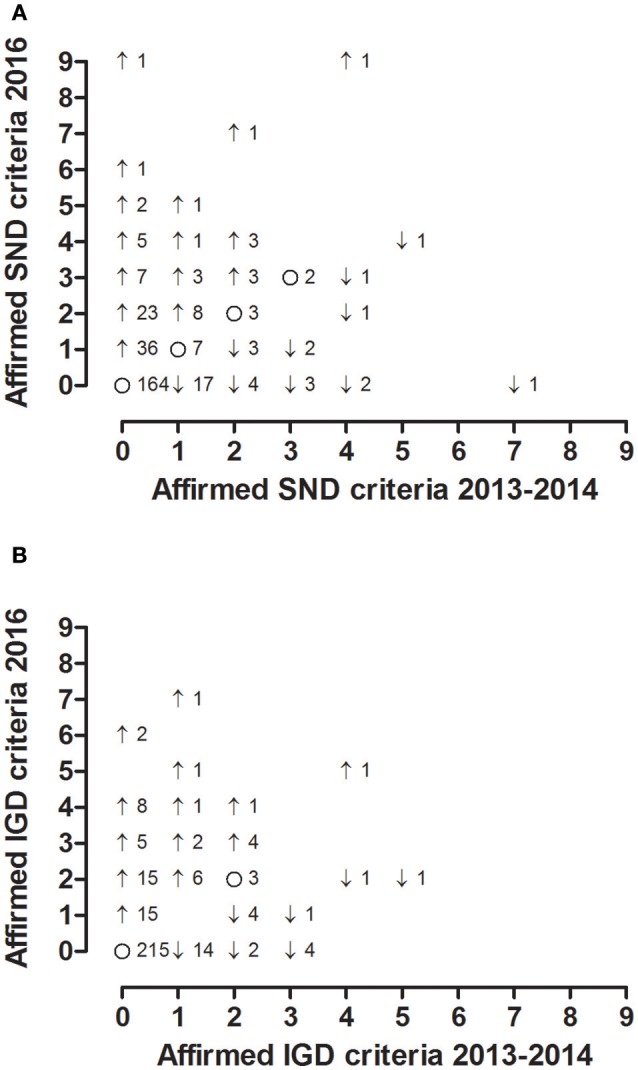
Figure 2.

The graphs plot the number of affirmed SND (A) and IGD (B) criteria quantified during the first survey conducted in 2013 and 2014 (x-axis) and during the second survey conducted in 2016 (y-axis). The figures next to the dots represent the number of underlying individuals. ↑ increase, ↓ decrease, and o no change of affirmed criteria during the follow-up. SND social network use disorder, IGD internet gaming disorder.
