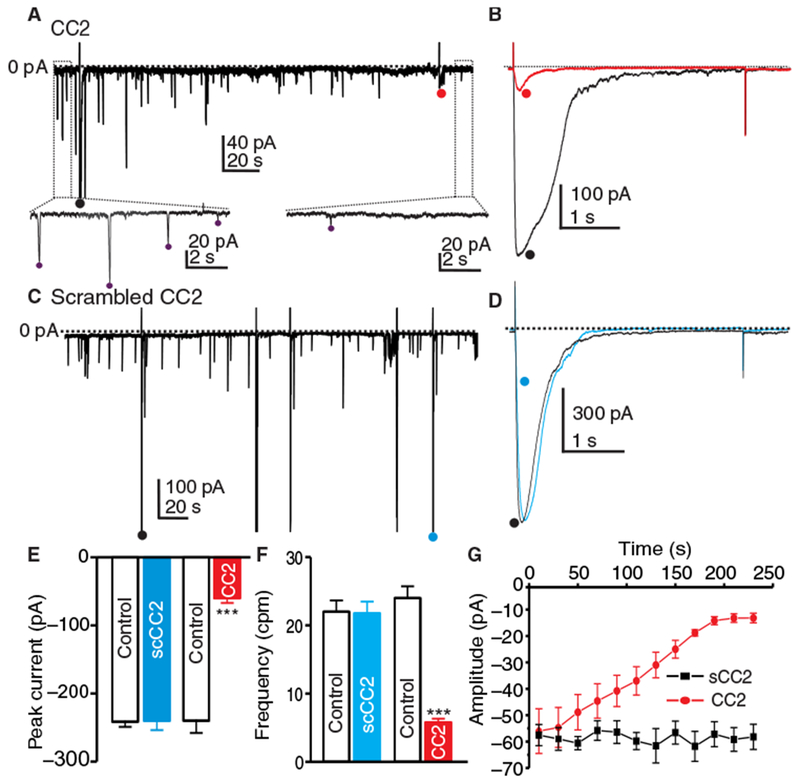
Fig. 7. Inhibition of STICs and slow wave currents by the CC2 peptide.

(A) Representative trace showing the effect of CC2 peptide (10 μM) added to Cs+-rich pipette solution (solution IV) on STICs recorded from ICC at −80 mV. Insets show expanded time scale from upper panel (dotted boxes) to display how STIC amplitude and frequency were measured. Purple dots (•) denote detection of STICs using event detection analysis. (B) Representative traces showing the effect of dialysis of the CC2 peptide on slow wave currents induced in ICC by step depolarization from −80 mV to −35 mV (5 s) [• (black trace) is the initial slow wave current, and • (red trace) is after CC2 peptide dialysis]. (C) Representative trace showing the effect of scrambled CC2 peptide (10 μM) on STICs at −80 mV. Stepping from −80 to −35 mV (5 s) induced slow wave currents in (B). (D) Representative traces showing the effect of dialysis of scrambled CC2 peptide on slow wave currents induced in ICC by step depolarization from −80 to −35 mV (5 s) [• (black trace) is the initial current, and • (blue trace) is after dialysis with scrambled CC2 peptide]. (E and F) Summary data showing the effects of CC2 peptide and scrambled CC2 peptide on the peak amplitude of slow wave currents (E) and frequency [cycles per minute (cpm)] of STICs (F). Data are means ± SEM (n = 5 cells for each group; ***P < 0.001, Student’s two-tailed t test). (G) Summary data showing amplitudes of STICs as a function of time during CC2 peptide and scrambled CC2 peptide dialysis. Data are means ± SEM (n = 5 cells for each group).
