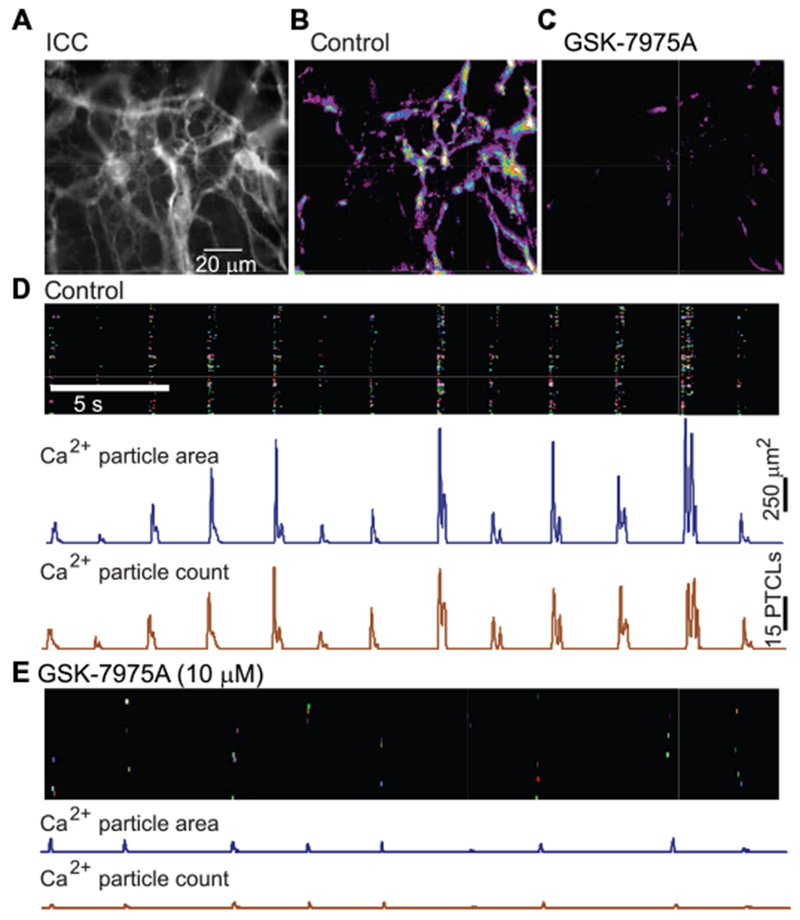
Fig. 9. Block of Ca2+ transients in ICC by GSK-7975A.

(A) Representative image of an ICC-MY network in situ in the small intestine of a Kit-Cre-GCaMP3 mouse (scale bar, 20 μm). (B) Representative heat map showing summation of Ca2+ transient PTCLs for a 20-s recording period under control conditions [same FOV as in (A)]. (C) Representative heat map showing summation of Ca2+ transient PTCLs for a second recording period after addition of GSK-7975A (10 μM) [same FOV as in (A) and (B)]. (D) Occurrence map of Ca2+ firing sites within the ICC-MY network shown in (A) and (B) during the control period [time scale in (D) also applies to (E)]. Each Ca2+ firing site within the FOV was individually color-coded and positioned in a lane and plotted against time. Summaries of Ca2+ PTCL area (in μm2) and PTCL count are shown in the traces below the occurrence map. (E) Occurrence map of Ca2+ transients from the same FOV in (A) and (C) after addition of GSK-7975A (10 μM). Summaries of Ca2+ PTCL area (in μm2) and PTCL count are shown in the traces below the occurrence map.
