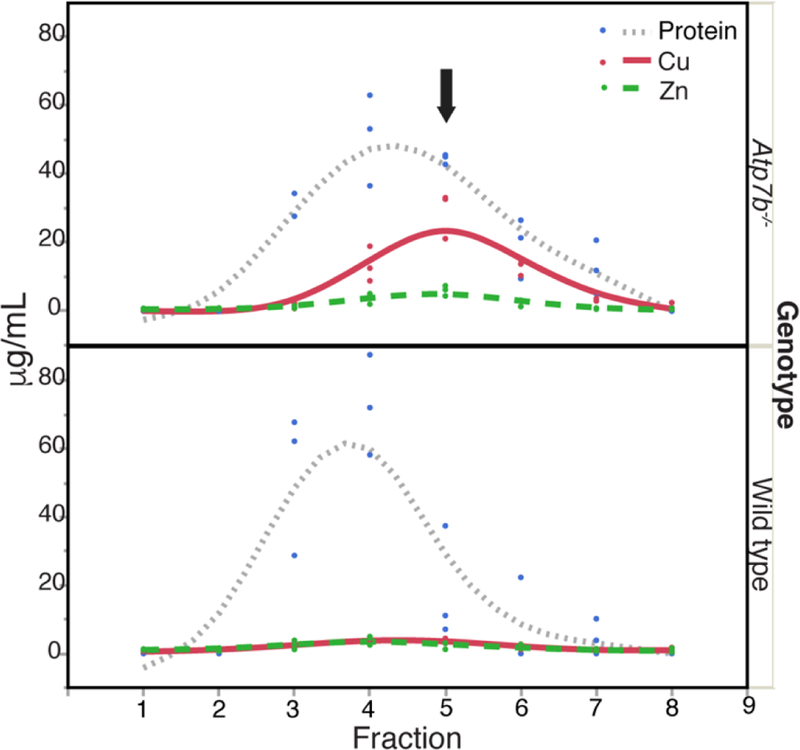
Figure 2.

Size-exclusion fractionation to analyze metals and relative MT content. Cu, Zn, and protein concentrations for size exclusion fractions encompassing low molecular weight soluble proteins extracted from Atp7b−/− and wild type liver. Fractions include sizes from approximately 44 to 1.3 kDa as estimated from standards. Black arrow indicates the fraction with highest Cu/Zn concentrations in Atp7b−/− samples.
