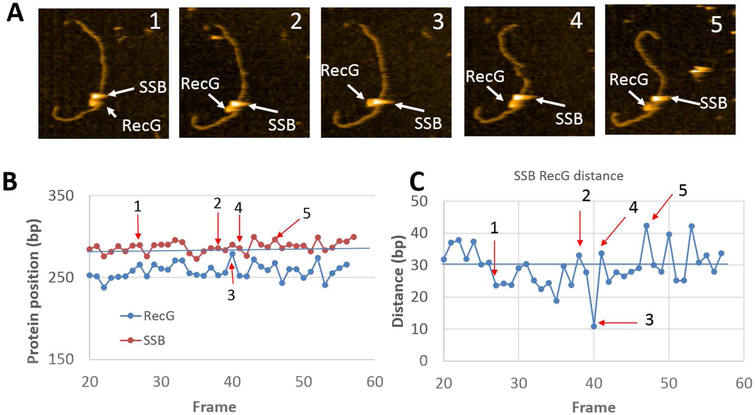
Figure 3.
Time-lapse experiments with SSB-RecG complexes formed on the F4 substrate. (A) Five frames selected from movie S1, demonstrating the dynamics of RecG over the parental strand. The arrows show positions of SSB and RecG. The images size is 200×200nm. (B) Distances of SSB (red curve) and RecG (blue curve) measured from the closest end of DNA over time. (C) Distance of RecG relative to SSB over time. The numbered arrows correspond to the location of AFM frames from (A).

