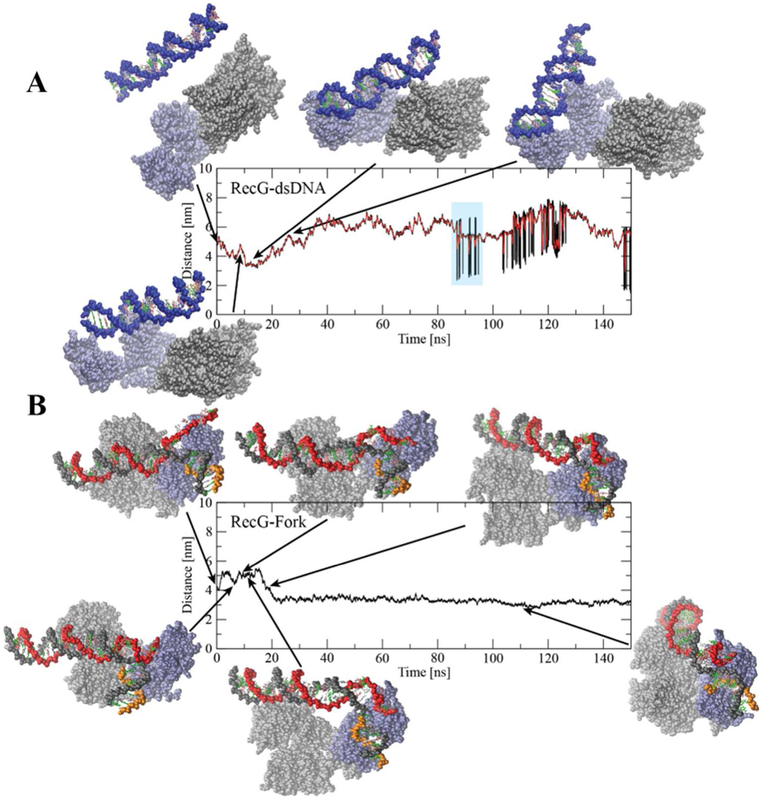
Figure 7.
Interaction of E. coli RecG with the DNA substrates characterized using MD simulations. (A) Results for interaction between RecG and 25 bp dsDNA showing COM distances between RecG and the DNA substrate versus time. Initially the dsDNA was placed parallel to RecG at a large distance. (B) COM distance between RecG and a stalled replication fork substrate from 150 ns MD simulation; key events are highlighted with a snapshot. RecG is presented as van der Waal spheres with the wedge domain colored in light blue and the helicase domain in grey. Each DNA strand is shown in a separate color to indicate the chain, and each base is given its own color.

