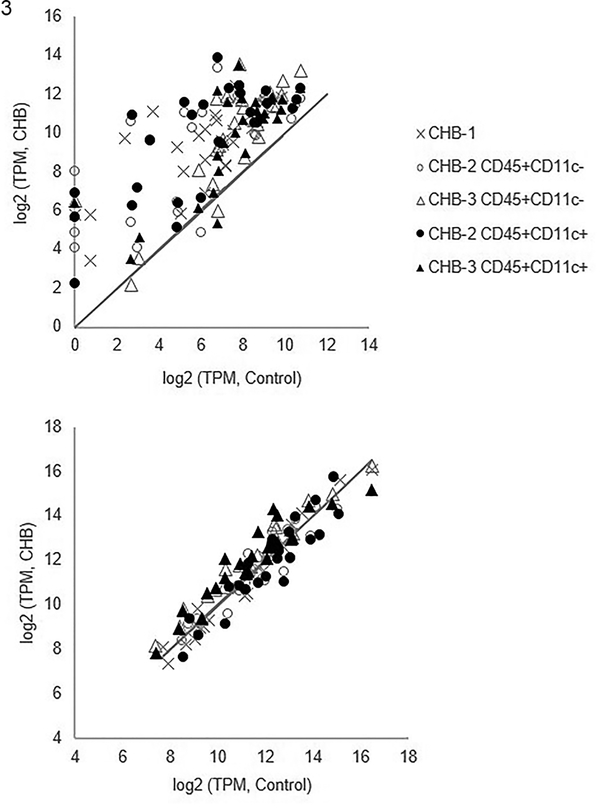
Figure 3. Expression of targeted candidate genes of flow-sorted human leukocytes derived from CHB and healthy fetal hearts.
Shown are log2 transformed transcripts per million (TPM) of CHB leukocyte populations (y-axis) and log2 transformed TPM of the same genes within control leukocyte populations (x-axis) using values of CHB-1, CHB-2, and CHB-3 with corresponding control values (Control-1, Control-2, and Control-3, respectively). The panels show IFN genes (Upper panel, genes listed in Table 1 plus SIGLEC1) and housekeeping genes (Lower panel, genes listed in Table 2). The solid line in both panels represents equivalent expression between CHB and control leukocytes. Notably, the transcripts within the IFN module plus SIGLEC1, but not the housekeeping module, are significantly elevated in CHB leukocytes compared to controls.

