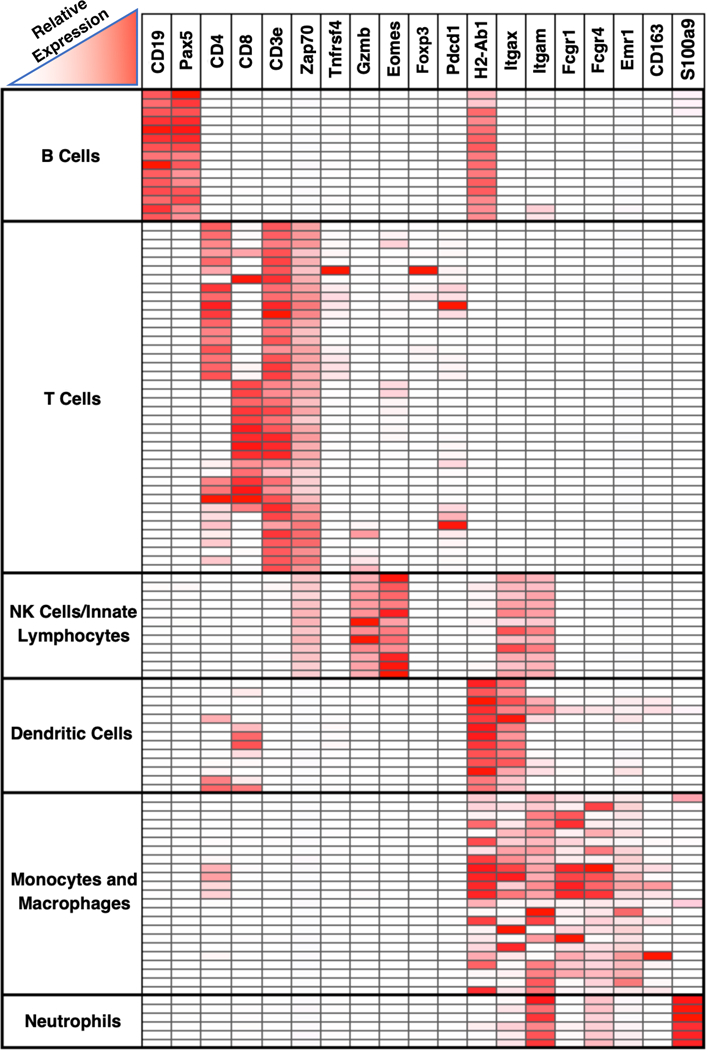
Figure 1. Heatmap depicting immune cell expression of markers utilized in our immunohistochemistry panel.

Micro-array data from ImmGen showing relative expression levels of different markers by different cell types (http://www.immgen.org ) (20). Rows represent different immune cell populations, grouped by cell type. Columns represent genes.
