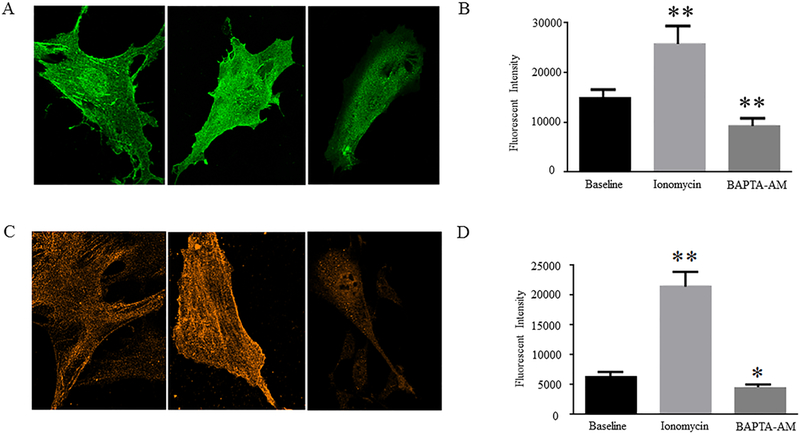
Figure 3: Effects of Ionomycin/BAPTA-AM treatments on expression of α5 integrin subunits and αSMA in rat VSMCs.

Representative confocal immunofluorescent images show A, α5 integrin expression and C, αSMA expression in the control, Ionomycin-treated, and BAPTA-AM-treated rat VSMCs. Graphs show comparisons of the intensities of B, α5 integrin-positive signals and D, αSMA-positive signals among different cell groups. Results are expressed as mean ± SEM; n = 40 cells from 3 rats in the control group; n = 32 cells from 3 rats in Ionomycin-treated group; and n = 34 from 3 rats in BAPTA-AM-treated group. **p<0.01 and *p<0.05 for comparisons between the control vs. drug-treated cells.
