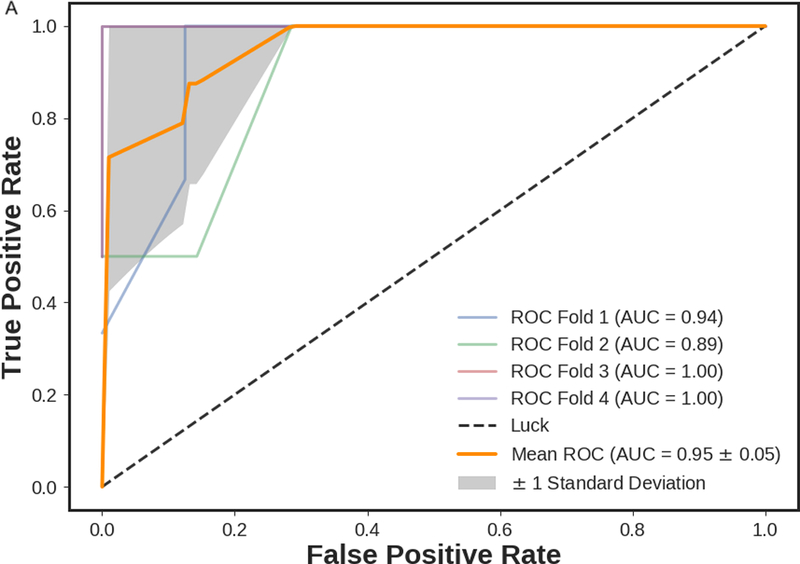
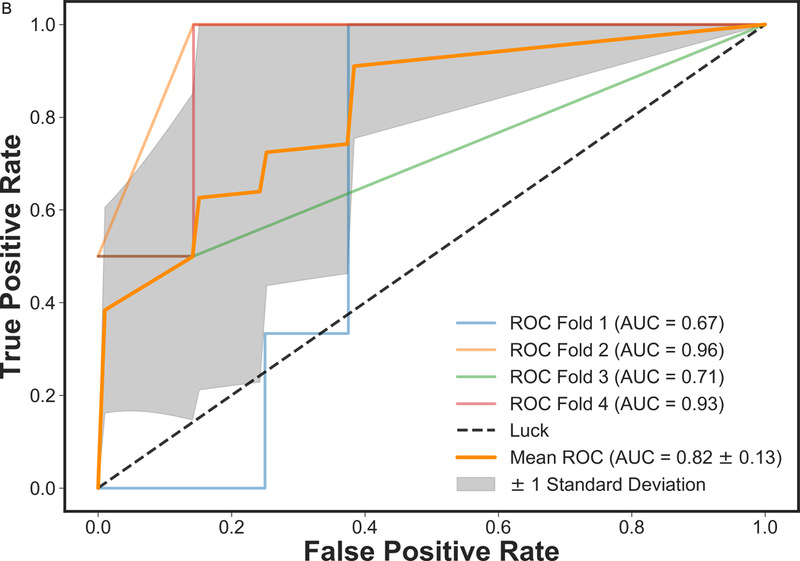
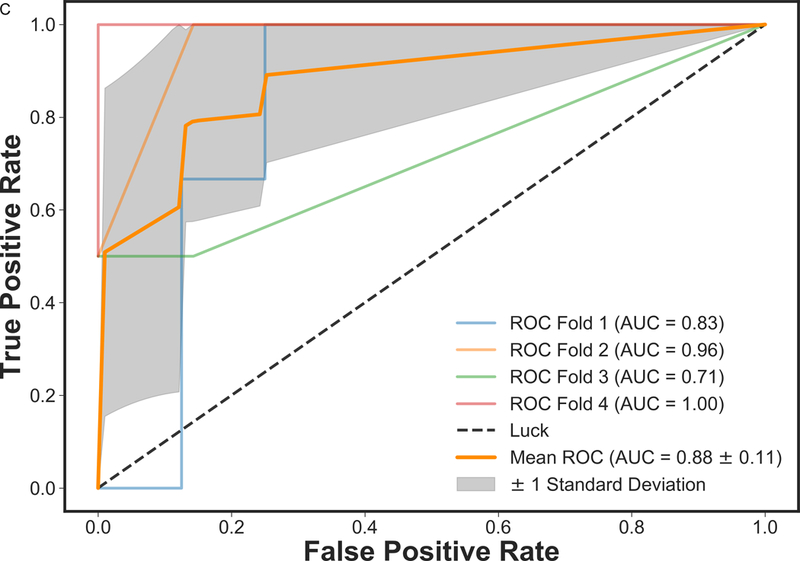
Figure 4.


ROC curves of mpMRI model using XGBoost classifier employing four-fold cross-validations in prediction of a) RCB class and b) RFS, and three-fold cross-validation in prediction of c) DSS. The solid orange lines present the mean ROC curve, the lighter lines illustrate the ROC curve for each fold, and the gray shaded areas provide the confidence interval for the predictions using mpMRI model.
