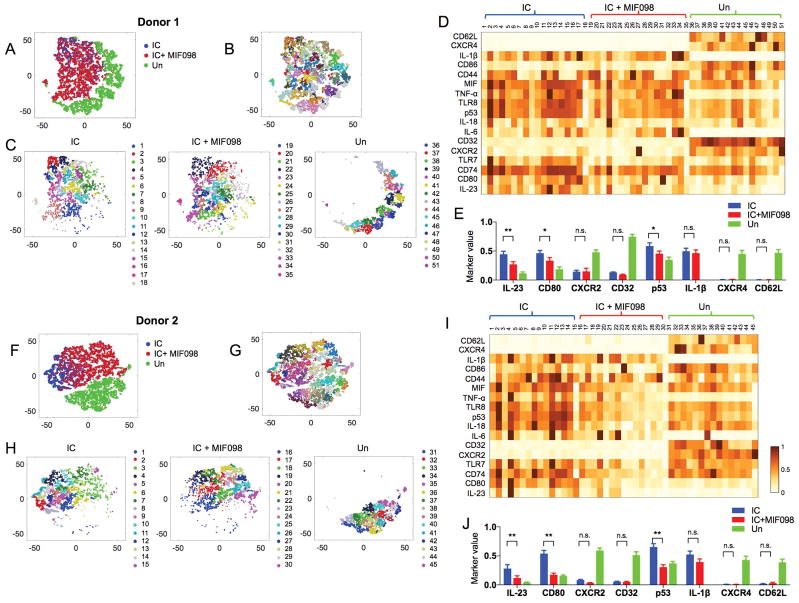
Figure 5. High-dimensional single cell analysis shows the unique cellular traits of monocytes stimulated with the snRNP immune complex (IC) that were altered by antagonizing MIF.
Monocytes were incubated for 5 hours with or without IC (U1-snRNP (5 μg/ml)/anti-U1-snRNP serum, 5% final concentration) alone or with MIF098 (20 μM) followed by CyTOF analysis. The PhenoGraph clustering was performed on monocytes based on the expression of 17 molecules (column labels in D and I). (A–C, F–H) t-SNE plots show a landscape of subsets and their relationships in the incubated monocytes. C and H show subsets identified by PhenoGraph clustering on monocytes incubated in indicated conditions. Numbers and matched color dots indicate individual cell subsets. D and I show mean expression levels of 17 molecules (rows) by the individual cell subsets (columns) identified in C and H. Values are scaled between 0 and 1 for each molecule. (E, J) Bar graphs show the intensity of each molecule expressed by individual subsets of the incubated monocytes identified in C and H. Bars and error bars indicate mean ± and SEM, respectively. P < *0.05, **0.005 by two-way ANOVA (multiple comparison controlled by the Benjamin, Krieger and Yekutieli method, FDR 0.05). N.S., not significant.

