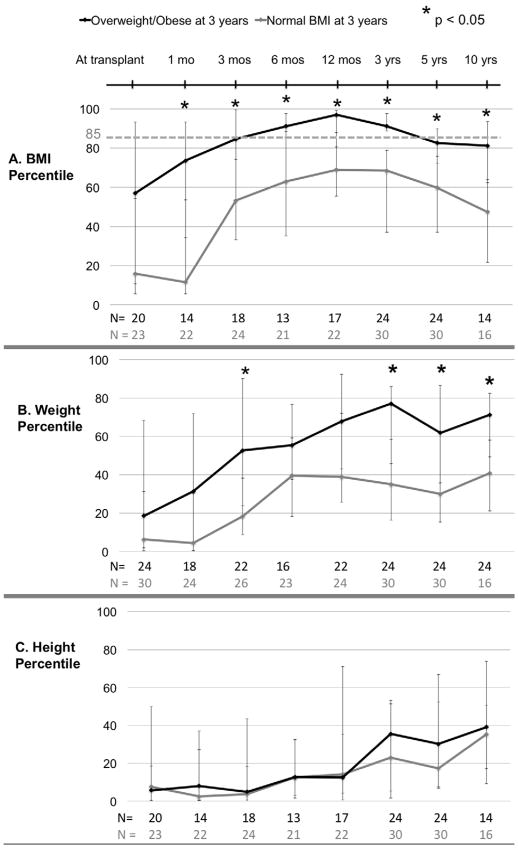
Figure 2.
BMI, weight and height percentile trajectories for pediatric liver transplant recipients by weight status at 3 years post-transplant (N= 54 with BMI available at 3 years post-transplant). (A) BMI percentile (B) Weight percentile (C) Height percentile. Data points indicate medians; error bars indicate 25th to 75th interquartile range. Asterisks (*) indicate p < 0.05.

