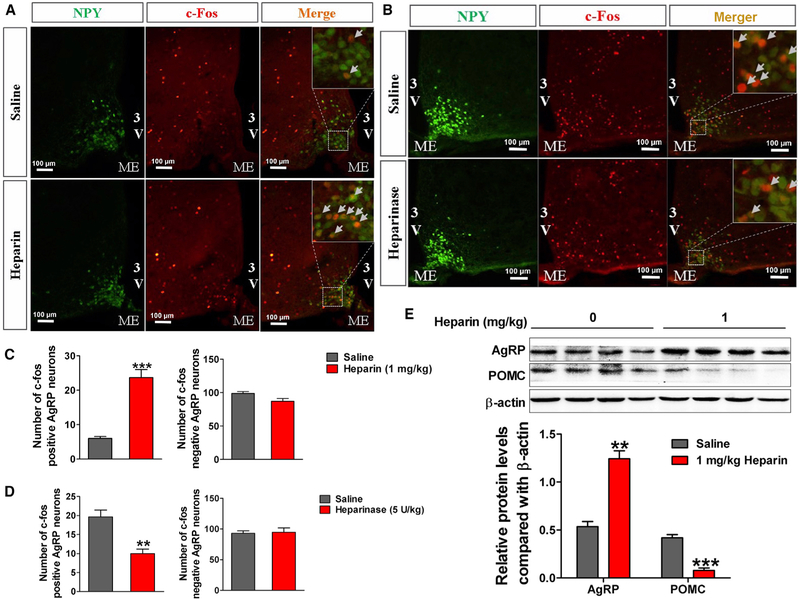
Figure 3. Heparin Increases AgRP Signal In Vivo.
(A and C) Representative images (A) and quantification (C) of c-Fos expression in the ARH of NPY-GFP mice 3 hr after i.p injection of 1 mg/kg heparin or saline.
(B and D) Representative images (B) and quantification (D) of c-Fos expression in the ARH of NPY-GFP mice 3 hr after i.p injection of 5 U/kg heparinase or saline.
(E) Immunoblots and quantification of AgRP and POMC protein expression in the hypothalamus of male C57BL6/J mice 3 hr after i.p injection of 1 mg/kg heparin or saline.
Results are presented as mean ± SEM. **p ≤ 0.01 and ***p ≤ 0.001 by non-paired Student’s t test.

