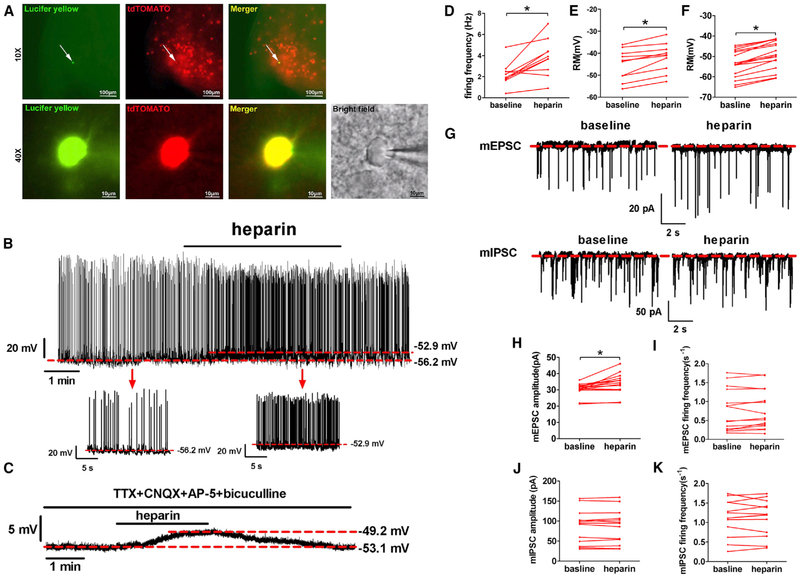
Figure 4. Heparin Activates AgRP Neurons Ex Vivo.
(A) Recording from a TOMATO-labeled AgRP/NPY neuron from AgRP-Cre/Rosa26-tdTOMATO mouse (top middle); lucifer yellow dye was injected into the recorded neuron for post hoc verification (top left) and merge (top right). Scale bars represent 100 μm. Low magnification of lucifer yellow (bottom left), td-TOMATO (bottom first middle), merge (bottom second middle), and bright field (bottom right). Scale bars represent 10 μm.
(B–F) Representative trace and statistic of AgRP neurons responding to heparin (100 μg/mL) in the absence (B, D, and E) or presence (C and F)of 1 μM TTX, 30 mM CNQX, 30 μM AP-5, and 50 μM bicuculline.
(G–K) Representative mEPSC and mIPSC trace (G) and statistics (H–K) of AgRP neurons responding to heparin (100 μg/mL).
Results are presented as mean ± SEM. *p ≤ 0.05 by non-paired Student’s t test.

