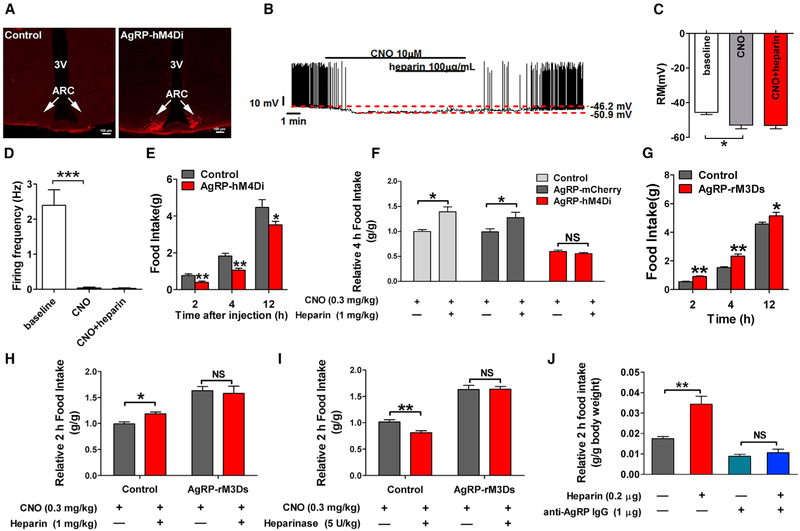
Figure 5. AgRP Neurons Mediate Orexigenic Effects of Heparin.
(A) mCherry fluorescence after injection of inhibitory AAV-hM4Di-mCherry into the ARH of WT or AgRP-Cre mice.
(B) Representative electrophysiological response to CNO (10 μM, bath) and heparin (100 μg/mL) in ARH AgRP neurons infected with inhibitory AAV-hM4Di-mCherry.
(C and D) Statistics of resting membrane potential (C) and firing frequency (D).
(E) Effects of CNO (0.3 mg/kg, i.p.) on dark-cycle food intake measured in male WT or AgRP-Cre mice receiving inhibitory AAV-hM4Di-mCherry infection in the ARH (n = 10 or 6 per group).
(F) Effects of CNO (0.3 mg/kg) co-injected with saline or heparin (1 mg/kg) on dark-cycle food intake measured in male WT or AgRP-Cre mice receiving inhibitory AAV-hM4Di-mCherry infection in the ARC. Another group of AgRP-Cre mice were injected with AAV-DIO-mCherry to serve as another control group (n = 10, 6, or 6 per group).
(G) Effects of CNO (0.3 mg/kg, i.p.) on dark-cycle food intake measured in male WT or AgRP-Cre mice receiving AAV-rM3D(Gs)-mCherry infection in the ARH (n = 6 or 5 per group).
(H) Effects of CNO (0.3 mg/kg) co-injected with saline or heparin (1 mg/kg) on dark-cycle food intake measured in male WT or AgRP-Cre mice receiving AAV-rM3D(Gs)-mCherry infection in the ARH (n = 6 or 5 per group).
(I) Effects of CNO (0.3 mg/kg) co-injected with saline or heparinase (5 U/kg) on dark-cycle food intake measured in male WT or AgRP-Cre mice receiving AAV-rM3D(Gs)-mCherry infection in the ARH (n = 6 or 5 per group).
(J) Dark-cycle food intake of female C57BL6/J mice after i.c.v. injection of saline, 0.2 μg heparin, 1 μg anti-AgRP IgG, or heparin + anti-AgRP IgG (0.2 μg + 1 μg) (n = 7 or 8 per group).
Results are presented as mean ± SEM. *p ≤ 0.05 and **p ≤ 0.01 by one-or two-way ANOVA followed by post hoc Bonferroni tests. See also Figure S3.

