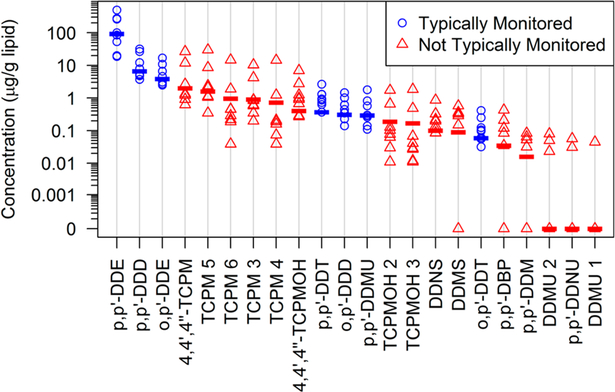
Figure 5.
Lipid-normalized concentrations of the 22 most abundant and frequently detected compounds in southern California bottlenose dolphins. Symbols represent individual samples (n = 8), and the dash represents the median. Blue dots indicate “typically monitored DDT compounds”, and red triangles indicate “not typically monitored DDT compounds” respectively. The acronyms are listed in the SI Part A.

