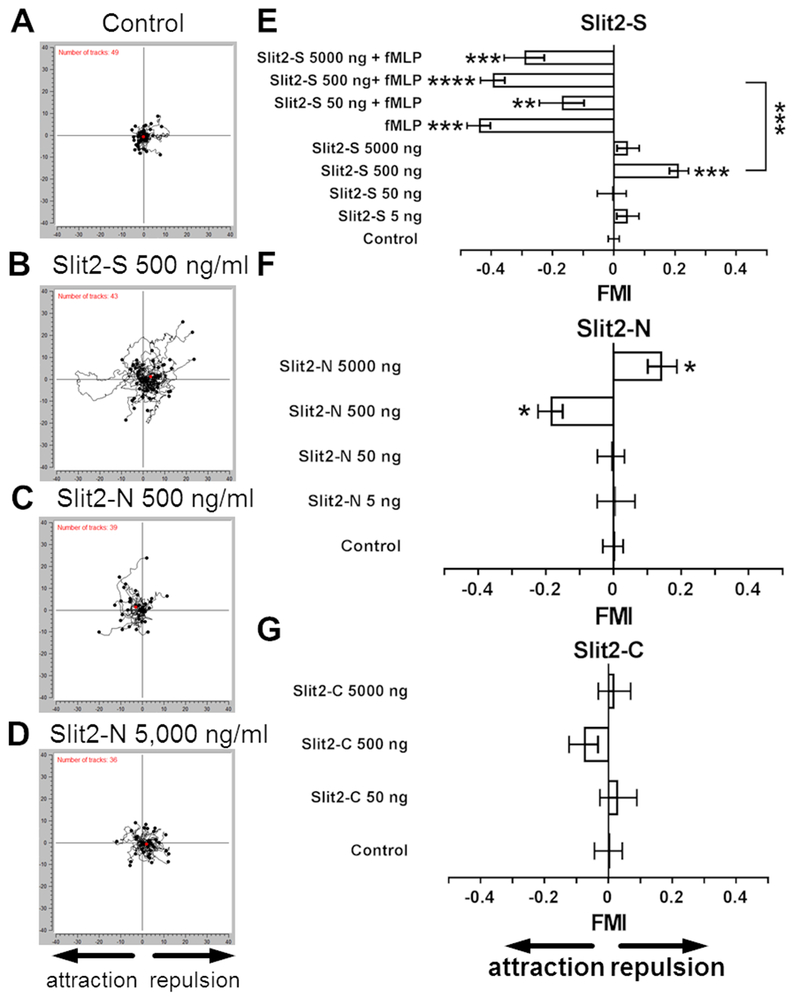
Figure 1. Neutrophils show biased movement away from Slit2-S and towards Slit2-N.
Neutrophils in (A) control, (B) Slit2-S 0-500 ng/ml, (C) Slit2-N 0-500 ng/ml, or (D) Slit2-N 0-5,000 ng/ml gradients were filmed and tracked. Orientation is such that the source of Slit2 is on the left. Graphs are data from one of 10 independent experiments. The number of tracks analyzed is indicated in the top left corner. Red dots represent the average center of mass for the ending positions of all cells. (E-G) Human neutrophils were placed in gradients of the indicated concentrations in ng/ ml of (E) Slit2-S in the presence or absence of 10 nM fMLP, (F) Slit2-N, or (G) Slit2-C using Insall chambers and videomicroscopy was used to record cell movement. A positive forward migration index (FMI) indicates chemorepulsion, and a negative FMI indicates chemoattraction. At least 10 cells per experiment group for each individual donor were tracked for 40 minutes. Values are means ± SEM for neutrophils from at least 5 different donors. * indicates p < 0.05, ** p < 0.01, *** p < 0.001 compared to the no gradient control (1-way ANOVA, Dunnett’s test), or for the indicated comparison between two sets (t test).

