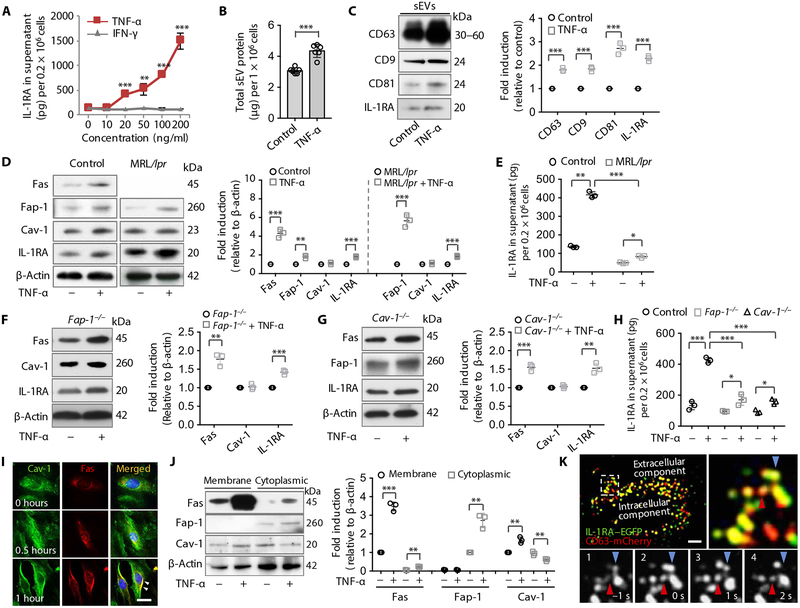
Fig. 4. TNF-α up-regulates Fas/Fap-1 expression to promote IL-1RA–sEV release in murine MSCs.
(A) ELISA analysis of IL-1RA secretion into the culture supernatant from GMSCs treated with tumor necrosis factor–α (TNF-α) or interferon-γ (IFN-γ) (n = 3). (B) Secreted sEV-associated proteins from control or TNF-α (20 ng/ml)–treated GMSCs (n = 6). (C) Western blotting and semi-quantification of CD63, CD9, CD81, and IL-1RA expression in WT control GMSCs with or without TNF-α (20 ng/ml) treatment. sEV-associated proteins from culture supernatants of equal numbers of cells were loaded for Western blotting analysis (n = 3). (D) Western blotting and semi-quantification analysis of Fas, Fap-1, Cav-1, and IL-1RA expression in WT GMSCs (left) and MRL/lpr GMSCs (right) treated with or without TNF-α (n = 3). (E) ELISA analysis of secretion of IL-1RA in the culture supernatant in control or MRL/lpr GMSCs treated with and without TNF-α (20 ng/ml) (n = 3). (F) Western blotting and semi-quantification of Fas, Cav-1, and IL-1RA in Fap-1 knockout GMSCs with and without TNF-α (20 ng/ml) treatment (n = 3). (G) Western blotting and semi-quantification of Fas, Fap-1, and IL-1RA in Cav-1 knockout GMSCs with and without TNF-α (20 ng/ml) treatment (n = 3). (H) ELISA analysis of IL-1RA in the culture supernatant of WT control, Fap-1, and Cav-1 knockout GMSCs treated with and without TNF-α (20 ng/ml) (n = 3). (I) Immunocytofluorescence staining of GMSCs at various time points after TNF-α (20 ng/ml) treatment. Scale bar, 20 μm. (J) Western blotting and semi-quantification analysis of Fas, Fap-1, and Cav-1 in membrane and cytoplasmic fractions of GMSCs treated with and without TNF-α (20 ng/ml) (n = 3). (K) TIRF microscopy images of IL-1RA–EGFP (green) and CD63-mCherry (red) cotransfected into WT GMSCs treated with TNF-α (20 ng/ml) for 0.5 hours. The top left panel is a higher magnification of the boxed region in the left image to show colocalization (yellow); the bottom panels show sequential images (1 to 4). Arrows indicate two individual IL-1RA–positive vesicle fusion events. Scale bar, 10 μm. *P < 0.05, **P < 0.01, ***P < 0.001. Error bars are means ± SD. Data were analyzed using independent unpaired two-tailed Student’s t tests (A to D, F, G, and J), or one-way ANOVA with Bonferroni correction (E and H).

