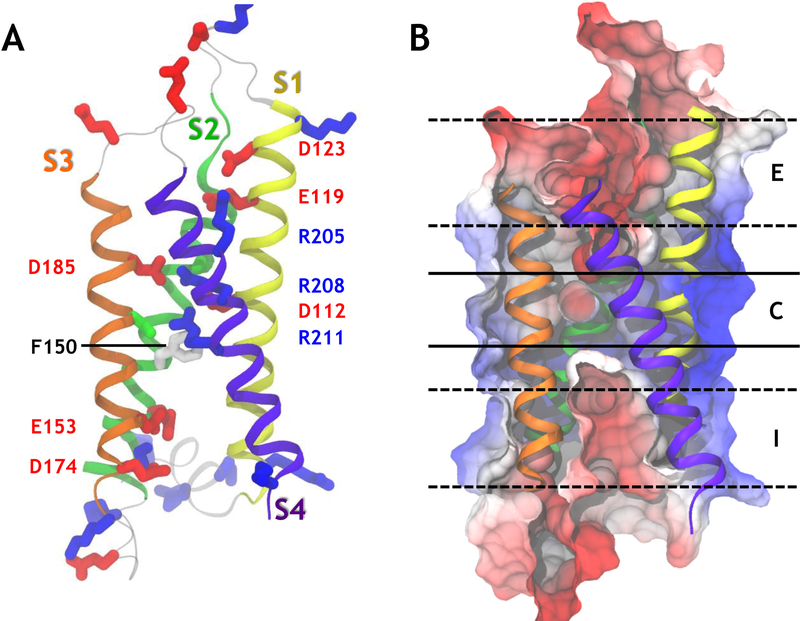
Figure 1:
Topology of the human voltage gated proton channel hHv1. (A) A representative snapshot of the open activated state of the human Hv1 protein is presented. The four helices of the helical bundle are represented as ribbons of different colors. The side chains of important residues are represented as sticks. Acidic residues are shown in red, basic ones in blue, polar ones in green and non-polar ones in white. (B) The electrostatic potential calculated over the last 100 ns of simulation #1 (Table S1) is projected onto a cut-through of the protein surface. Negative potentials are shown in red and positive potentials are represented in blue. The color scale ranges from −385 mV to 128 mV. The three main binding sites along the central pore (red patches) are labeled I, C and E, from the most intracellular to the most extracellular region.

