Figure 3:
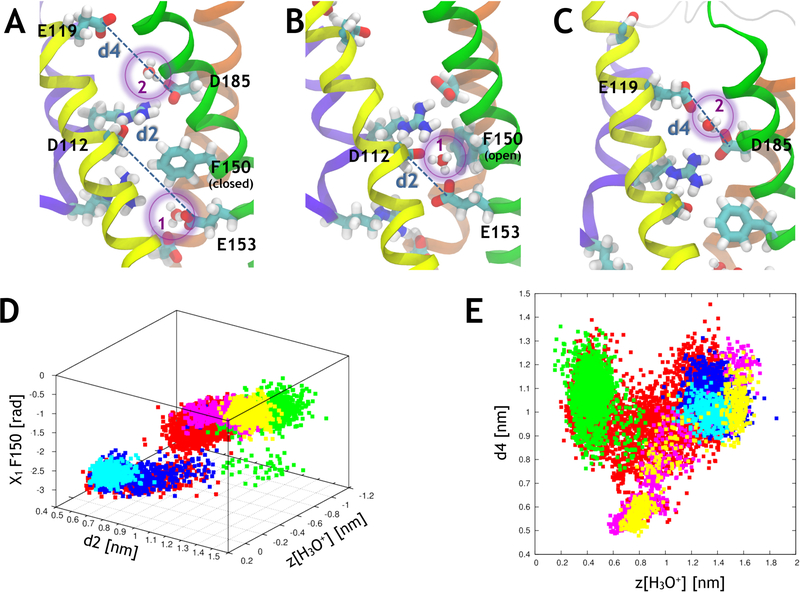
Correlations between various variables during proton transport through hHv1. (A) Simulation setup with 2 H3O+ molecules located in the channel, H3O+(1) is in I and H3O+(2) is in C. F150 is in its closed conformation and prevents H3O+(1) from transferring to C. The representations are the same as in Figure 2. The distances found in panels D and E are represented for clarity. (B) F150 reorients outwards and H3O+(1) is found in a bridging position between E153 and D112. (C) H3O+(2) is found in a bridging position between D185 and E119. (D) The position of the H3O+(1) ion (the origin is located at the center of the helical bundle) of the channel is correlated with the distance between E153 and D112 (d2) and with the X1 dihedral angle of F150. (E) The position of the H3O+(2) is correlated with the distance between D185 and E119 (d4). The data points come from five separate simulations (#28 in red, #30 in green, #31 in blue, #32 in cyan and #33 in yellow, see Table S5).

