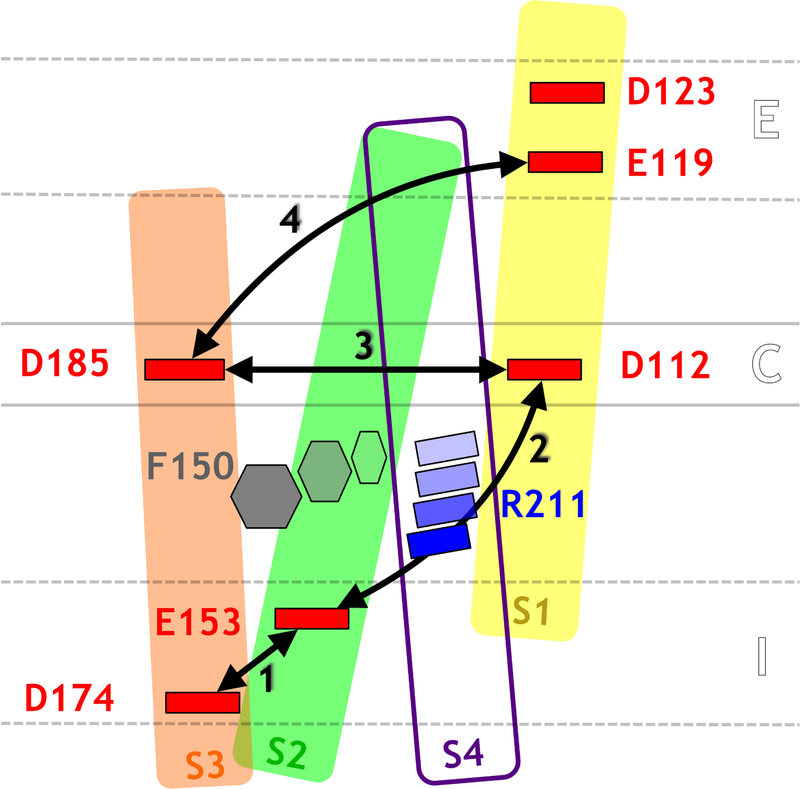
Figure 4:
Schematic representation of the conformational rearrangements occurring during proton transport through hHv1. Colors are the same as in Figure 1. The distances for which the Pearson correlation coefficients were calculated are represented as black arrows. As the proton hops outwards, pairs of acidic residues (1, 2, 3 and 4) come in closer contact in a sequential manner. During step 2, the proton hops from E153 to D112 through a water molecule. This is made possible by the reorientation of the F150 and R211 side chains.

