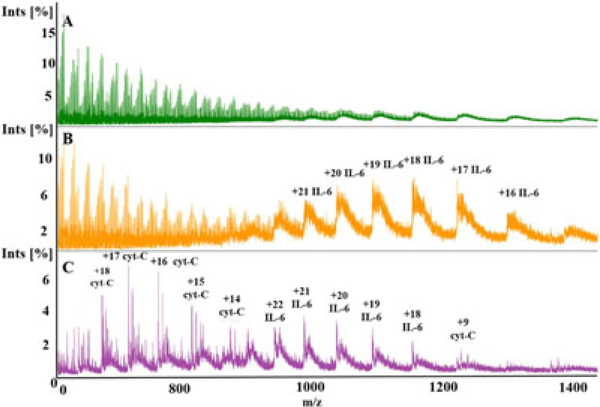
FIGURE 6.
Mass spectra produced via direct infusion electrospray ionization mass spectrometry through dynamic mass spectrometry probe (DMSP). Each spectra normalized by highest intensity peak. A, Untreated 1×PBS with 5 μM cytochrome-c (12 kDa), 5 μM IL-6 (21 kDa), and 5 μM IL-8 (8.4 kDa) shows no identifiable peaks associated with protonation of biomolecules. Normalization value 2,715 counts. B, 1% AA treatment reveals multiple charge states associated with IL-6 only. Normalization value 4,823 counts. C, 1% AA + 2% m-NBA treatment reveals nonadducted charge states of cytochrome-c and IL-6. In all cases, IL-8 is not visible due to unintended removal through the membrane being the smallest (lowest molecular weight) biomolecule in the protein mixture. Normalization value 34,180 counts. AA: acetic acid; m-NBA: 3-nitrobenzyl alcohol; IL: interleukin; phosphate-buffered saline [Color figure can be viewed at wileyonlinelibrary.com]

