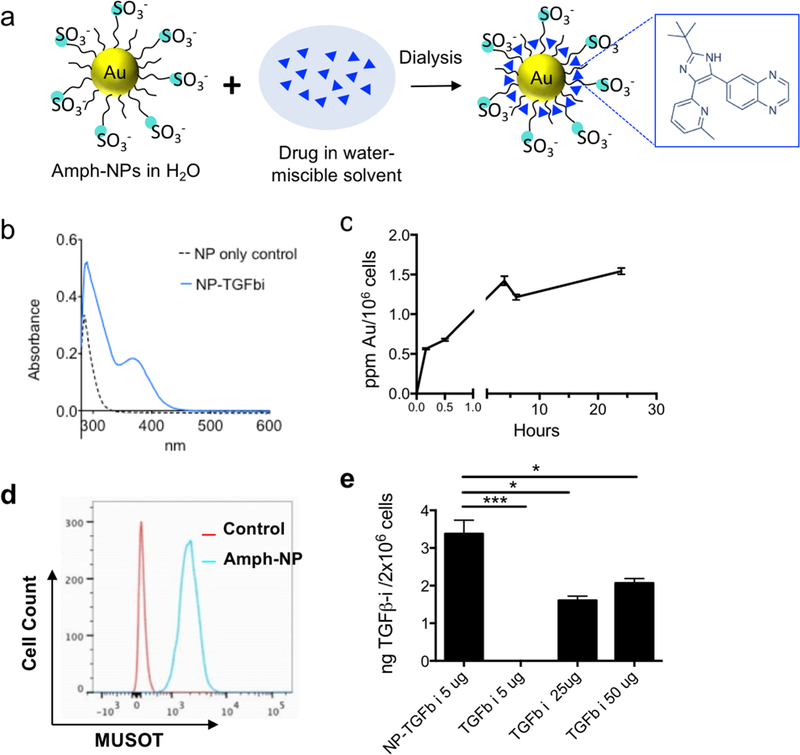
Figure 1. TGF-βi drug loading, quantification and cellular uptake in CD8+ T cells in vitro.

(a) Schematic illustration of small molecule TGF-βi sequestration in the amphiphilic ligand shell of amph-NPs. (b) Unloaded amph-NPs or amph-NPs loaded with TGF-βi were treated with β-mercaptoethanol to disrupt the ligand shell followed by UV-vis absorbance measurements to detect released TGF-βi. (c) Primary CD8+ T cells from C57Bl/6 mice were incubated with 0.1 mg/mL amph-NPs at 37°C for varying times and then total gold content was assessed by ICP-OES (n=3 samples/condition). (d) CD8+ T cells were incubated with 0.1 mg/mL BODIPY-labeled amph-NPs at 37°C for 3 hr and then analyzed by flow cytometry, compared to unmanipulated control T cells. (e) Primary murine CD8+ T cells were incubated in serum-containing medium with NP-TGF-βi or free TGF-βi at the indicated drug concentrations for 4 hr, followed by HPLC analysis of intracellular TGF-βi concentrations. *, p < 0.05; *** p < 0.001 by ANOVA with Tukey’s post test.
