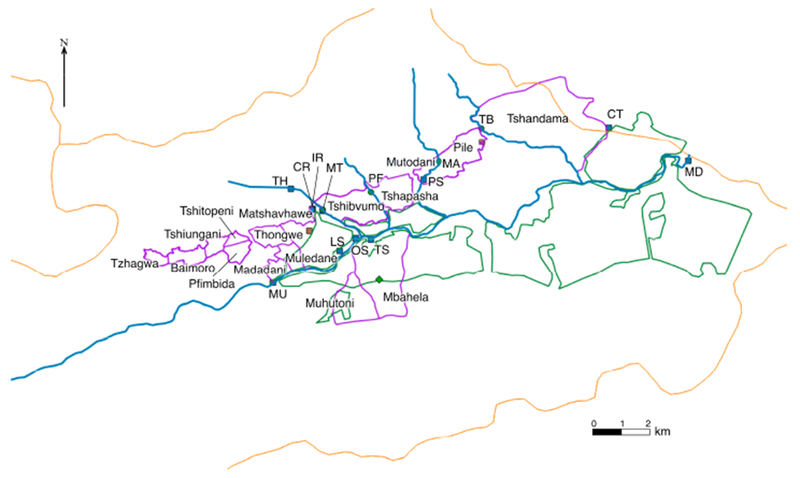
Figure 1.

Map of the study area. The communities are all located within the Mutale River watershed. The rivers are indicated in blue, villages outlined in purple, environmental samples in blue squares, tributaries in green circles (which have intermittent flow), watershed boundary in orange. This heavily agricultural area has cultivated areas along both sides of thee Mutale River for the vast majority of the region; the area is shown with green outlines. There are two identified brick-processing areas shown in brown rectangles. Unfortunately, some sites are so close that the markers overlap (as with CR and IR). The location of the community supplies (CA, CB, and CC) are not shown to protect the privacy of those villages. See supplemental information for Google Earth files.
