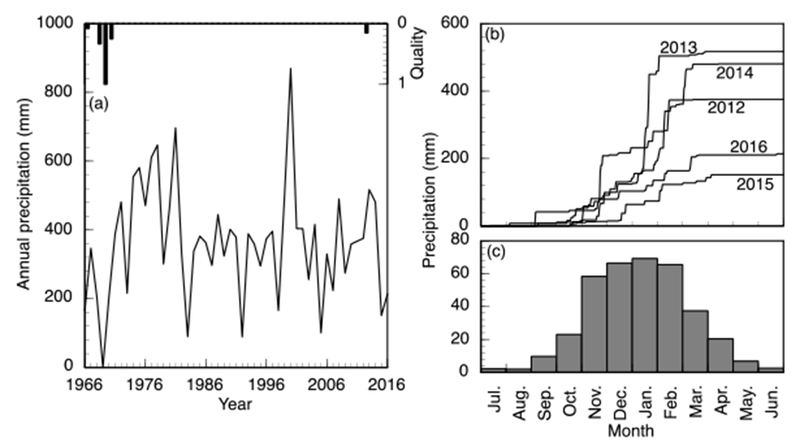
Figure 2.

Precipitation trends in the study area. (a) Annual precipitation by hydrologic year. Data quality are presented on a scale of zero to unity where the quantity shown represents the proportion of missing or unreliable data in a year; (b) Cumulative precipitation for the last five complete years; (c) Average monthly precipitation calculated for years with greater than 90% reliable data (bottom right). All data are presented by the standard Southern hemisphere hydrologic year from July to June numbered with the ending year. Data are from the Nwanedzi Natural Reserve at the Luphephe Dam (17 km from the study area) and fire available through the Republic of South Africa, Department of Water and Sanitation, Hydrologic Services (http://www.dwa.gov.za/Hydrology/).
