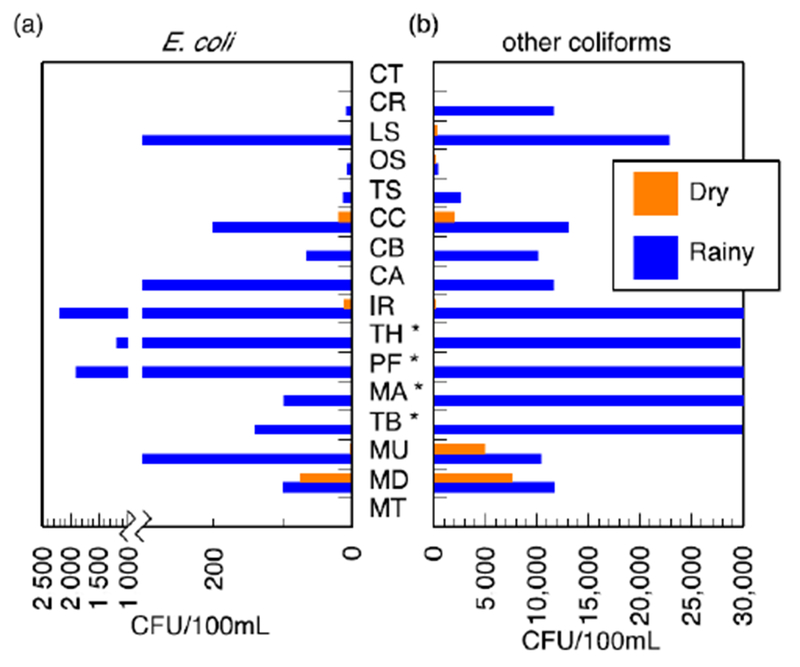
Figure 4.

Membrane filtration results for (a) E. coli and (b) other coliforms. Data are presented for wet and dry seasons. The four ephemeral rivers (*) have no dry season data because they had no flow; all other sources have the results reported, some of which are zero or near-zero. South African National Standard (SANS 241:1-2015) set the limit of 0 CFU/100 mL for E. coli and 10 CFU/100 mL for total coliforms (CFU/10−4 m3). Ephemeral rivers that do not flow all the way into the valley are indicated (*) in the dry season.
