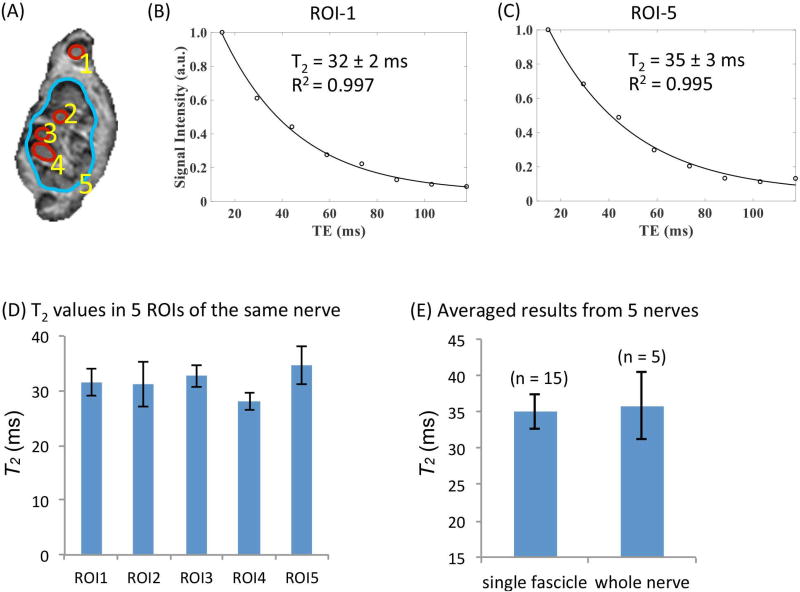
Figure 1.
Single-component T2 measurements using a clinical CPMG sequence with TEs = 14.7, 29.2, 44.1, 58.8, 73.6, 88.3, 102.9 and 117.7 ms. (A) Illustration of the definitions of single-fascicle ROIs and large-ROIs (CPMG, TE = 14.7 ms). (B) Representative T2 fitting result in a single-fascicle ROI (ROI1 as shown in Fig. A) and a large ROI (ROI5 as shown in Fig. A). (C) T2 values measured from the five ROIs defined in (A). (D) Average T2 values measured from 15 single-fascicle ROIs and 5 large ROIs (i.e., 3 single-fascicle ROIs and one large ROI from each nerve. Five nerves were measured in total.)

