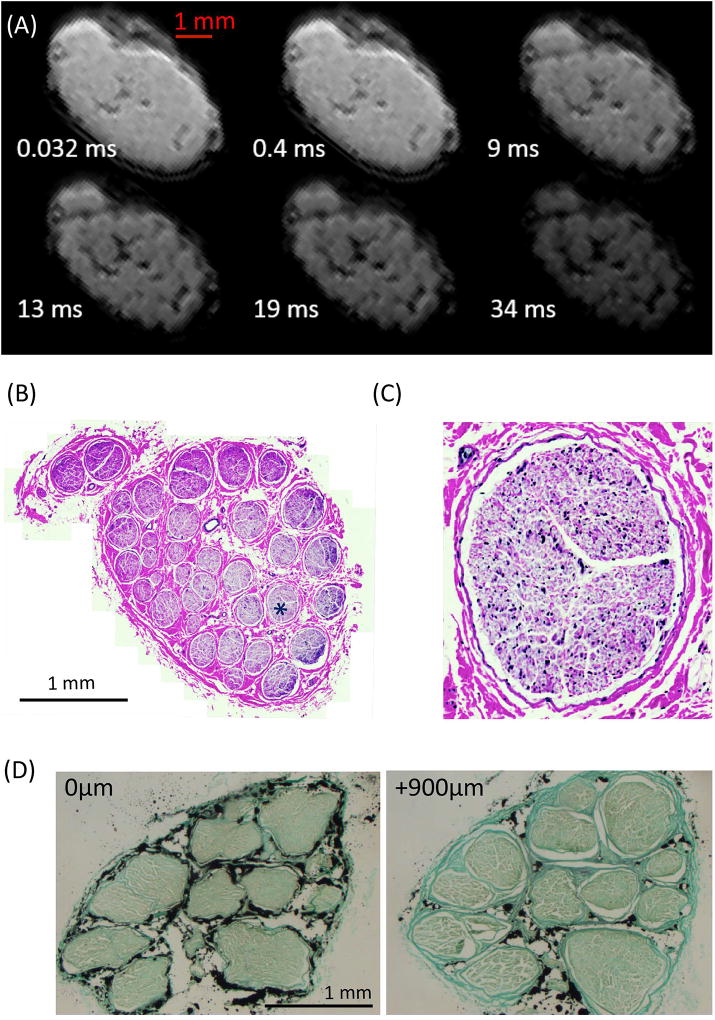
Figure 2.
(A) 3D Cones UTE images of one representative nerve with TEs marked on each image. (B–C) H&E staining images of the whole nerve (B) and a single fascicle (C, as marked with a ‘*’ in (B)). (D) H&E staining of two slices ~1mm apart show similar fascicular organization and structure, indicating the validity of mapping histological outcomes from histological ROIs to MR ROIs.

