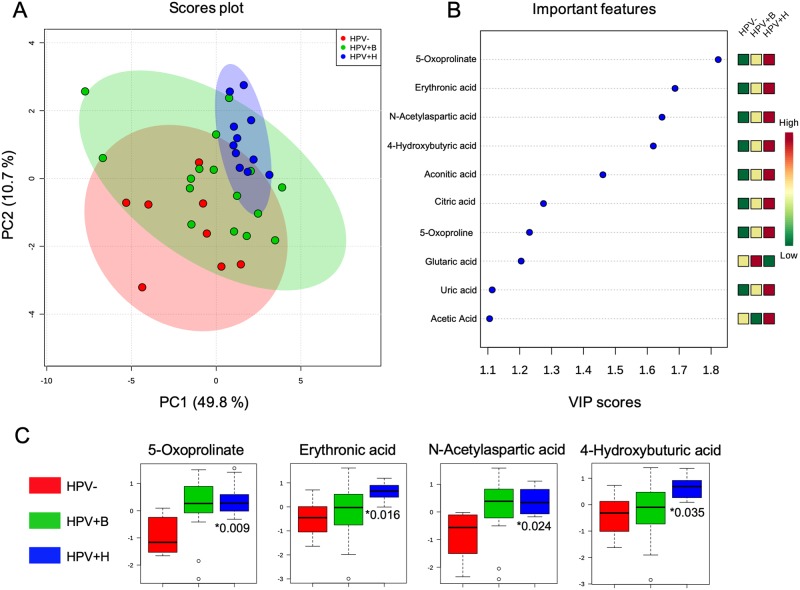
Fig 1. Metabolites discriminating HPV-, HPV+B and HPV+H patients.
(A) Partial-least discriminant analysis (PLS-DA) score plot. (B) Variable importance in projection (VIP) plot with cut-off ≥ 1.0. (C) Box-and-whisker plots depict the most significant metabolites, with the top two: 5- Oxoprolinate and N-Acetylaspartic acid changes in HPV+B and HPV+H groups relative to HPV-. *Adjusted P value. Y-axis shows the normalized relative abundance. RT—Retention time; VIP—Variable importance in projection scores identified via PLS-DA analysis for the PC1; Adj P–Adjusted P value determined using the Holm-Sidak method in comparison to HPV- group, α = 0.05. *—indicate metabolite that matches selected criterion.

