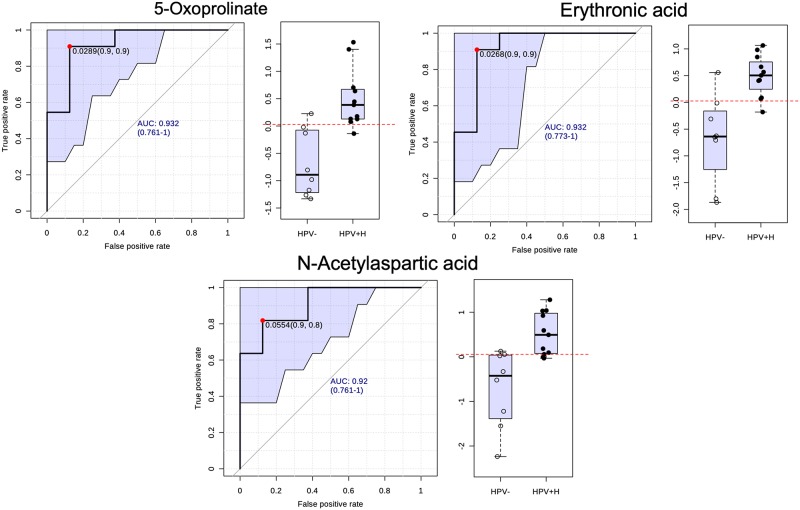
Fig 2. Urine biomarkers predicted by ROC curve analysis curve with 95% confidence interval (shadowed).
Box-and-whisker plots show the distribution of abundance values of 5-Oxoprolinate, Erythronic acid and N-Acetylaspartic acid in HPV- vs HPV+H samples with the optimal cut-off as a horizontal dotted red line.

