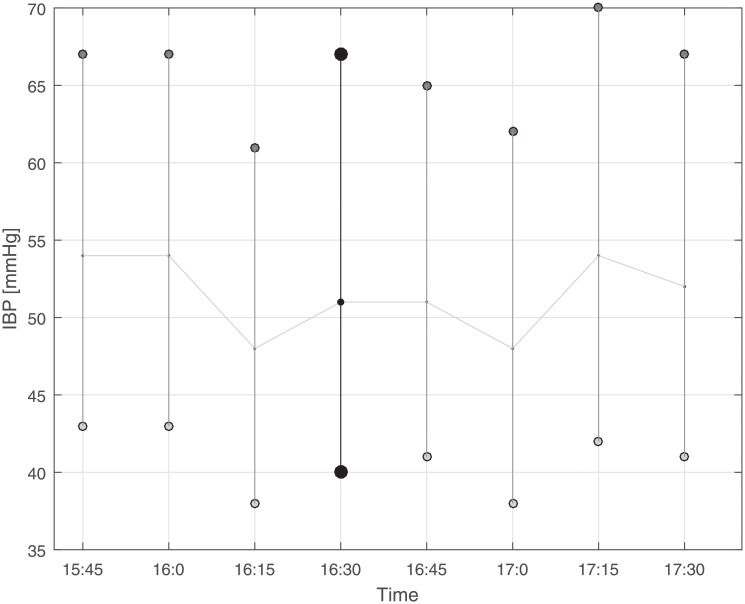
Fig 1. Illustration of invasive blood pressure (IBP) readings (approximately one hour before and one hour after the non-invasive blood pressure (NBP) reading considered for analysis) as it was used to screen IBP tracks for potential artifacts or inconsistency.
Since the changes in this example were only moderate (less than 10 mmHg), the IBP marked with black circles was selected for analysis. Note that the NBP reading was not visualized in the figure in order to blind selection/exclusion of IBP readings.

