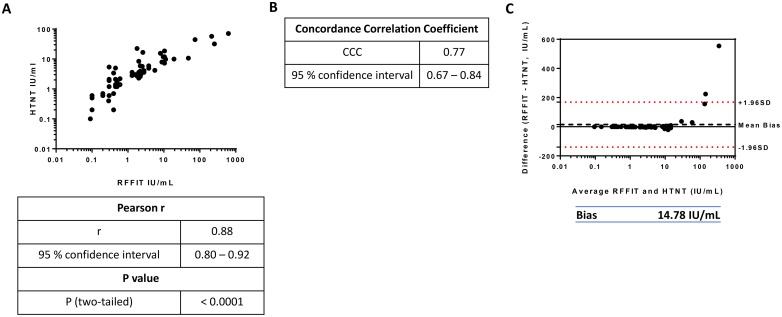
Fig 5. Comparison of HTNT and RFFIT titers of human sera.
Titers (IU/ml) of positive human sera were compared between the two methods. Titers were log-transformed for normalization purposes. (A) HTNT titers were plotted against RFFIT titers to determine the Pearson correlation coefficient. Similarly, the concordance correlation coefficient (B) and the Bland-Altman plot of differences (C) were calculated. In (C), the mean difference of the titers is represented by the Bias value, plotted as a black dotted line above 0. The limits of agreement, within which 95% of the differences between RFFIT and HTNT are denoted by the red dotted lines above and below 1.96 standard deviations of the mean difference.

