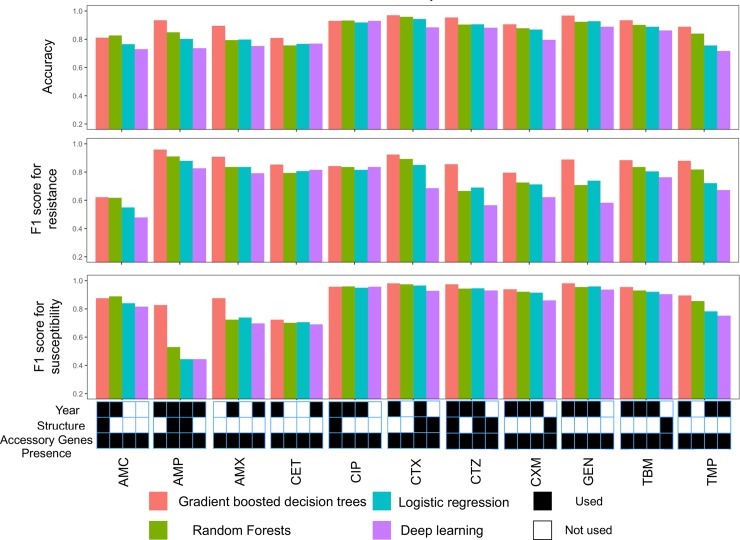
Fig 1. Prediction performance of the best tuned models.
Accuracy and F1 score (harmonic mean of precision and recall; y-axis) for resistant (top panel) and susceptible (middle panel) phenotypes for four predictive models (red: gradient boosted decision trees; green: logistic regression; teal: random forests; purple: deep learning) across eleven antibiotics (x-axis). The best model of each class for every drug (x-axis) was identified based on the accuracy for predicting resistance and employed a number of possible combinations of gene presence, population structure, and year of isolation (lower panel; black: feature used; white: feature not used).

