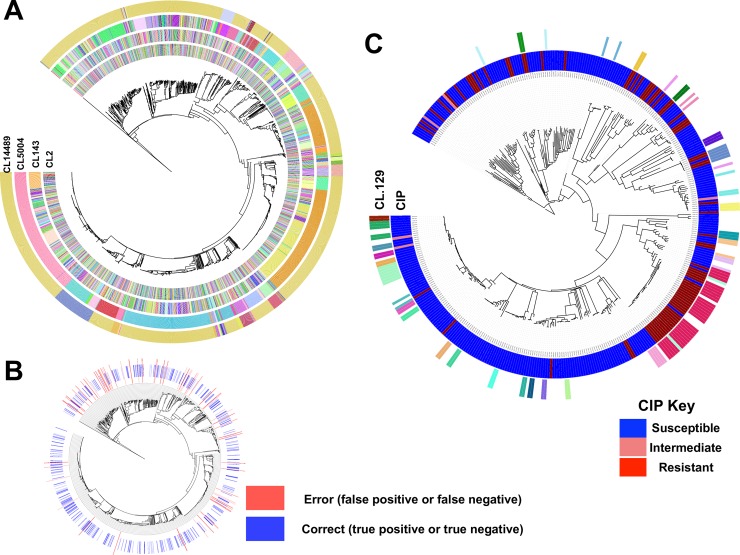
Fig 2. Population structure and phenotypic distribution of the input data.
A) Phylogenetic distribution of clusters identified in the population for SNP distance cut-off values of 2, 143, 5054 and 14489 (outer circles) relative to the phylogenetic tree. B) Phylogenetic distribution of correct calls (true positives, true negatives) and errors (false positives, false negatives) when predicting cephalothin (CIP) resistance with the best performing gradient boosted model. The accuracy for resistance was 0.91. C) Phylogenetic distribution of the most important identified population structure feature, clustering with SNP cut-off of 129 (outer ring), compared with the phylogenetic distribution of resistance phenotype (inner ring; blue: susceptible; light red: intermediate and red: resistant) on the test dataset. Clusters with more than one member are shown.

