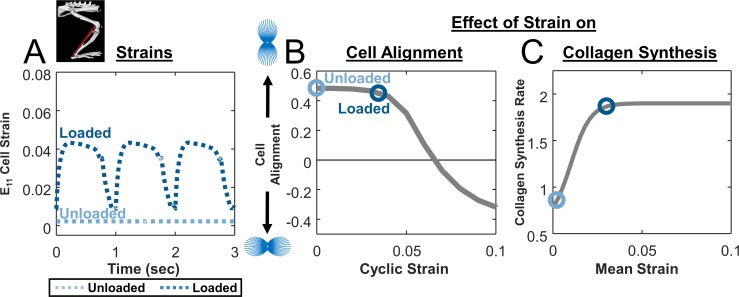
Fig 3. Effect of strain on cellular alignment and collagen synthesis.
(A) Estimated cellular strain profiles derived from tendon strain profiles predicted by modified rat hindlimb model. (B) Cellular alignment response curve generated by model of stress fiber dynamics in response to cyclic stretching at various magnitudes and a frequency of 1 Hz with a 1h on, 1h off repeating cycle during waking hours (gray line); open circles show the operating points on this curve for simulated unloading (light blue circle) and loading conditions (dark blue circle) in unrepaired tendons. (C) Response curve showing the effect of mean strain on fibroblast collagen synthesis rate (gray line), again overlaid with circles showing the operating points for the specific cases simulated in Fig 2.

