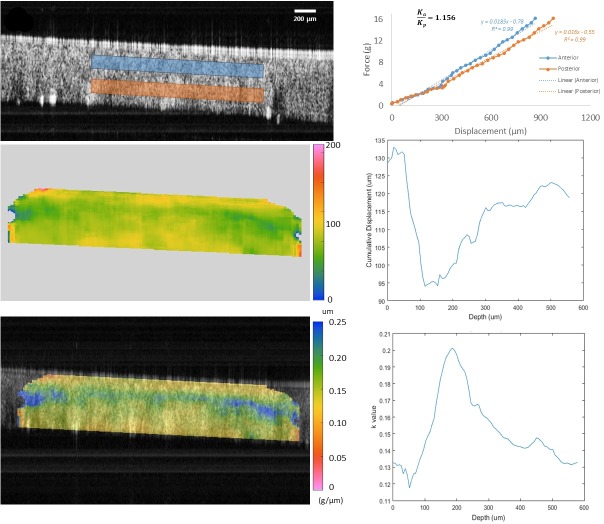
Fig 2. Example OCT elastography results for the right eye of patient one.
Top left: Frame of the point of maximum compression. Anterior (blue box) and posterior (red box) stromal regions of interest were defined to generate the force/displacement relationships on the right. Note that the corneal epithelium was intact in all eyes (visible in top left frame) and was included in all analyses except the anterior/posterior stromal region comparisons. Top right: Force vs. displacement plot depicting differences in axial stiffness approximations for the anterior and posterior stromal regions. Higher slopes are consistent with stiffer behavior. Middle Left: Cumulative displacement map of the central cornea in microns. Middle Right: Depth-dependent cumulative displacement profile along a central 100um wide band (averaged laterally) through the depth of the cornea. Bottom left: Elastography map overlaid with the corneal image of the point of maximum compression presenting local values for the slope of the force (grams) vs. displacement (μm) relationship, an approximation of axial/compressive stiffness. Cooler colors indicate higher approximate stiffness corresponding to smaller displacement magnitudes than warmer colors. Bottom right: Depth-dependent k profile, representing the approximate stiffness behavior along a central 100um-wide band (averaged laterally) through the depth of the cornea.

