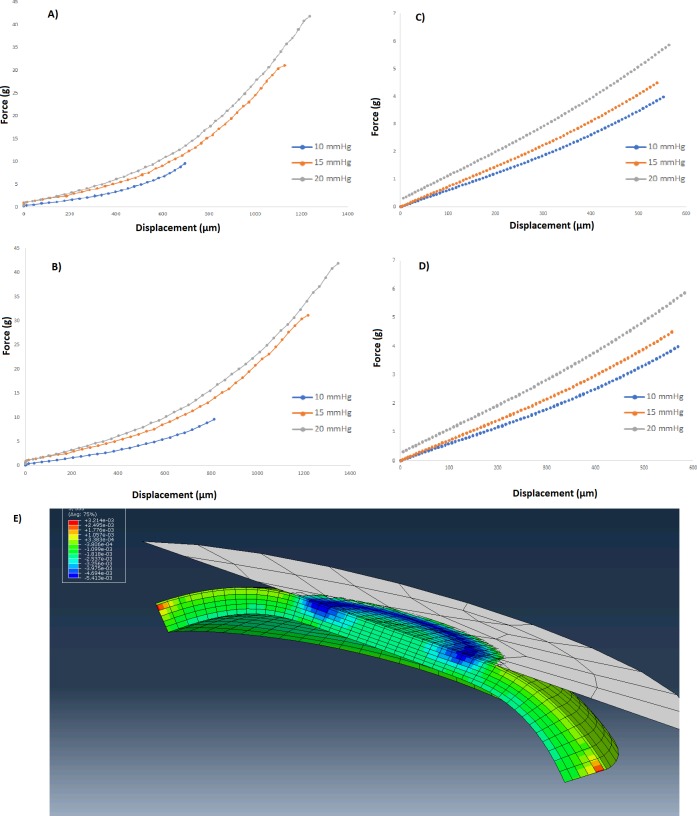
Fig 4. System sensitivity to the intra-eye IOP variability.
Anterior (A), and posterior (B) force/displacement curves from donor eye experiment with IOP values of 10, 15, and 20 mmHg. Anterior (C) and posterior (D) force/displacement curves from in silico experiment with 10, 15, and 20 mmHg IOPs. E: Axial corneal stresses under compression from in-silico study at IOP = 15mmHg.

