Figure 5.

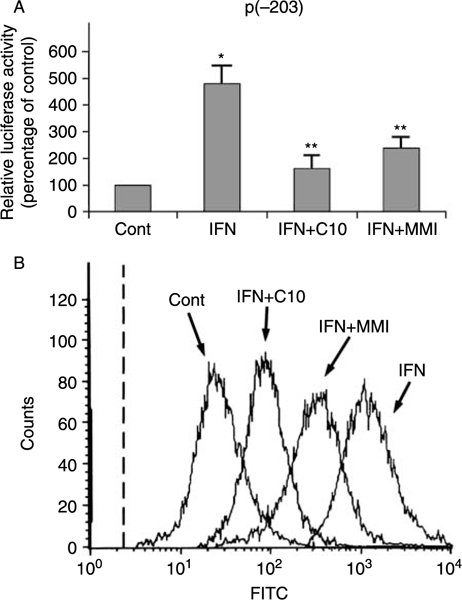
Effects of C10 and MMI on IFN-γ-induced increase in MHC class-I gene expression. (A) G418-resistant FRTL-5 cells stably transfected with p(−203)Luc were grown and prepared as detailed in Materials and Methods, with final treatments in 6H medium with 0·5% DMSO as vehicle (Cont) or 100 U/ml IFN-γ without or with 0·5 mM C10 or 5 mM MMI as indicated for 36 h. Luciferase activity is expressed as percentages of control activity, with data as means of three separate experiments. *P<0·05 compared to control; **P<0·05 compared to IFN. (B) Flow-cytometric analysis of the expression of surface MHC class-I molecules. FRTL-5 cells were grown and prepared as detailed in Materials and Methods, with final treatments in 6H medium as in (A) as indicated for 48 h. The cells were stained with a fluoresceinated monoclonal antibody that specifically reacts with epitope S of the rat MHC class-I molecule. The dashed line represents the isotype-matched control.
